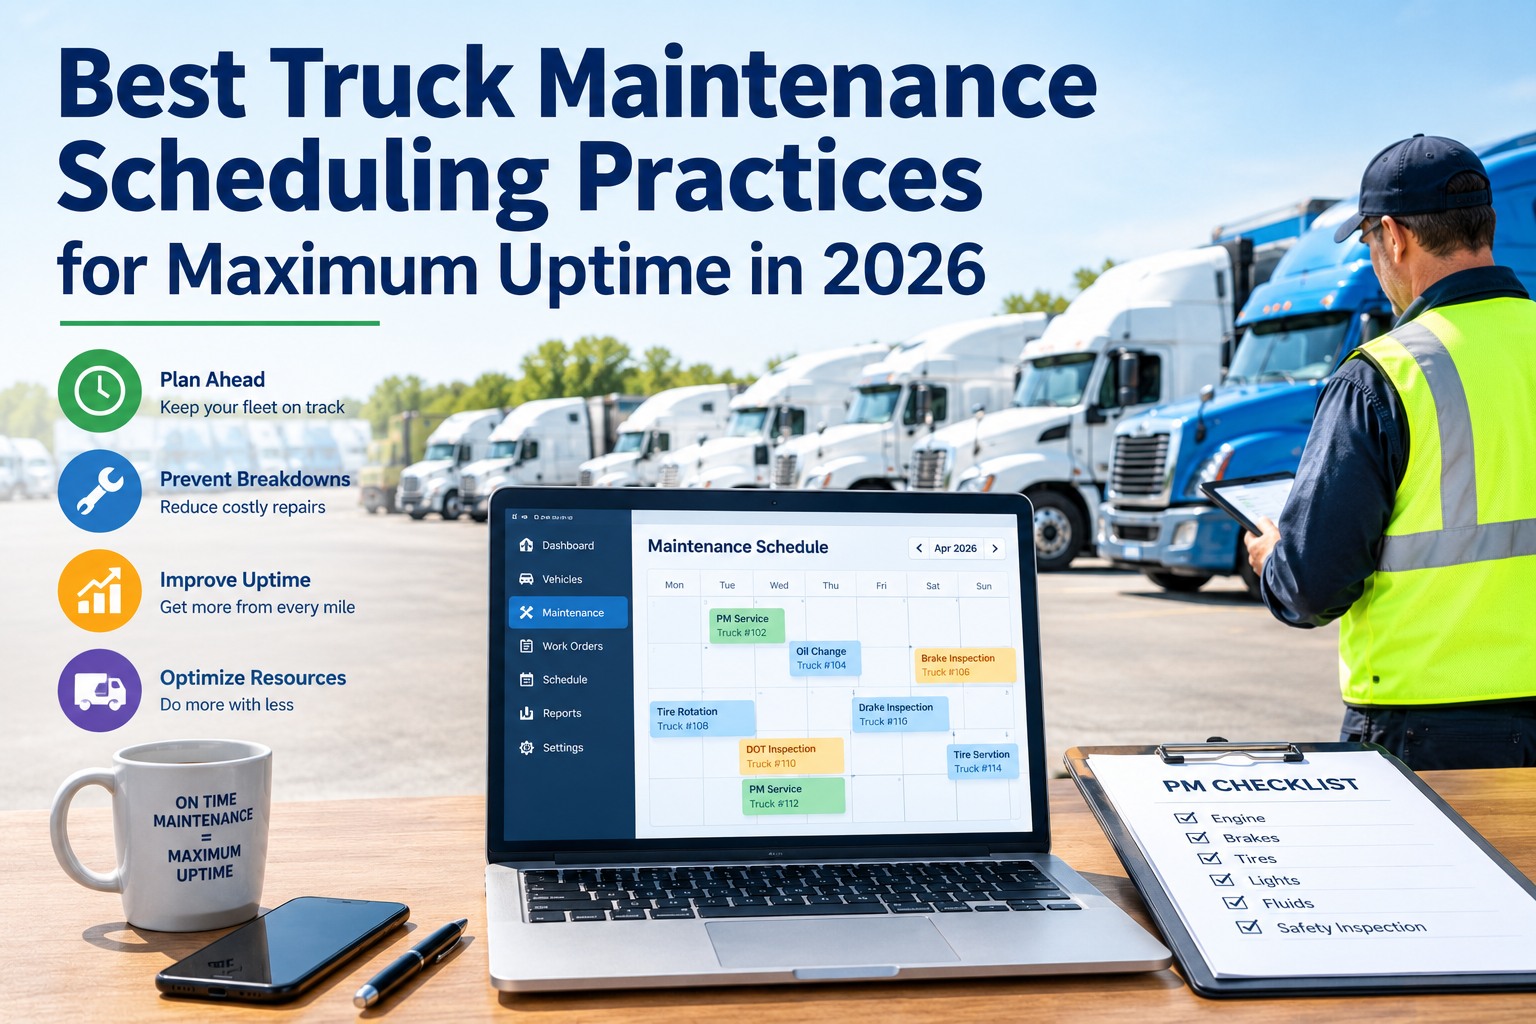
Most fleets have the PM checklist, the shop capacity, and the parts inventory to run a healthy maintenance program. What they don't have is the scheduling discipline to actually complete PMs on time without gutting dispatch. A truck that hits PM-B trigger on a Tuesday morning either goes into the shop and comes out of revenue, or stays on the road and starts running past its wear window. The scheduling problem is the whole game — every good fleet's PM compliance rate lives or dies on the calendar model they use. This guide breaks down the scheduling models that top fleets actually run, the weekly grid pattern that makes it work, the conflict-resolution rules that keep dispatch and shop from fighting, and the KPIs that show whether it's working. Truck Inspection & Maintenance ships with scheduling workflows built for real fleet operations — sign up free or contact our team.
Best Truck Maintenance Scheduling — Practices for Maximum Uptime in 2026
PM compliance isn't a checklist problem — it's a scheduling problem. Fix the calendar model and the numbers follow.
Why PM Compliance Lives or Dies on the Calendar Model
Three numbers show why scheduling is the whole game, not the checklist:
Top-quartile fleets hit 95%+ PM compliance to trigger. Bottom-quartile fleets sit at 62-75% for one reason — no calendar model, so PMs slip past trigger and pile up.
Fleets running under 80% PM compliance see 2-3x the roadside breakdown rate of fleets above 95%. The missed PMs directly become the roadside events.
Shops without a scheduling model waste 15-20% of technician-hours to walk-ins, re-work, wait time, and parts-not-in-stock. That's the equivalent of one lost tech per shop of 6.
Below 80% PM compliance = 2-3x roadside events. Start a free account and put your PMs on a real capacity model.
The 5-Level Scheduling Maturity Ladder
Every fleet sits somewhere on this ladder. Where you sit predicts your PM compliance rate and your roadside breakdown rate:
No scheduled PM at all. Trucks go into shop when broken. PM compliance below 40%, roadside events frequent, insurance surcharges climbing.
PMs tracked in Excel or Google Sheets, someone manually notifies dispatch. PM compliance 60-75%. Depends on the person maintaining the sheet not leaving.
PMs auto-fire from CMMS on miles or engine hours. WO created automatically. PM compliance 80-88%. Still no integration with dispatch — scheduling conflicts unresolved.
PM triggers, shop capacity, and dispatch availability shared on one calendar. Auto-suggest optimal slot when trigger fires. Conflict rules pre-set. PM compliance 92-96%.
Telematics fault codes + wear predictions feed into scheduling. Repairs consolidated with adjacent PMs when possible. Parts pre-staged. PM compliance 96%+, roadside events near zero.
Want a printable 5-level scheduling maturity ladder for your team review? Contact our team and we'll send one, free.
The One Design Principle That Separates Level 3 from Level 4 — Reserve 30% Capacity for Repairs, Not PMs
The most common Level 3 failure pattern: shop is booked 100% with PMs Monday through Friday, no capacity left for repairs. Truck comes in with a defect on Tuesday, gets bumped to next Monday, defect sits on the road for 6 days. Level 4 shops book PMs at roughly 60-65% of weekly capacity, reserve 25-30% for repair queue, and hold 5-10% flex/buffer. When Tuesday's defect hits, the mid-day repair slot is already sitting there open. That single capacity-reservation change is worth more than any dispatching software feature — it eliminates the "shop full, road full" trap that produces most fleet backlog. Start a free account and structure your weekly capacity model with reserved repair slots today.
The Conflict-Resolution Decision Tree
Half of scheduling conflicts trace to no pre-agreed rule for who wins when dispatch and shop need the same truck. Set the rules once, then let them run themselves:
Put the conflict-resolution decision tree on a shared calendar dispatch and shop both see — sign up free and configure in under 20 minutes.
The 6-Step Weekly Scheduling Rhythm
Top fleets run scheduling as a weekly cadence, not an ad-hoc reaction. Six steps every Monday morning:
Monday 06:00 — Pull PM Trigger Report
Auto-generated report of every truck within 5% of PM trigger this week. Sorted by trigger urgency. Dispatch, shop foreman, and fleet manager see the same list.
Monday 07:00 — Assign PM Slots for the Week
Foreman assigns each PM to a specific weekday time slot from available capacity. Fills 60-65% of shop hours. Reserves 30% for repair queue, 5-10% for flex.
Monday 08:00 — Dispatch Sync
Dispatch reviews PM assignments against loads booked. Conflict-resolution tree runs on any overlap. Firm calendar published to drivers by 09:00.
Monday 10:00 — Parts Pre-Stage
Parts department pulls kit for every scheduled PM. Missing items ordered same-day for delivery before scheduled slot. Shop starts week with parts on shelf, not on order.
Daily 16:00 — Rollup + Reforecast
End-of-day: what completed vs planned, what slipped, what's tomorrow. 15-minute standup between foreman and dispatch. Slippage reforecasts before it snowballs.
Friday 15:00 — Weekly Retrospective
What worked, what didn't, what to adjust next week. PM compliance %, repair-close rate, capacity utilization tracked. Trends inform next Monday's plan.
Need help mapping the Monday-to-Friday rhythm to your current shop hours? Get in touch for a free 15-minute review.
Scheduling built for the shop-dispatch-fleet triangle instead of any one seat in it.
Weekly capacity grid, PM auto-triggers on mileage + hours, conflict-resolution rules on shared calendar, parts pre-stage workflow. Free forever for up to 3 vehicles — create your free account or talk to our team.
KPI Dashboard — 6 Scheduling Metrics That Matter
Six numbers that tell you whether the scheduling model is actually working:
PMs completed within +5% of trigger. Below 95% = scheduling model isn't catching triggers fast enough.
Portion of weekly shop hours booked for scheduled PMs. Above 75% = no room for repairs. Below 50% = shop under-utilized.
Portion held for repair queue. Below 25% = defects sit on road. Above 35% = capacity waste on empty slots.
Driver logs defect to shop WO opened. Above 24 hr = repair queue slower than defects arriving.
PMs with parts kit staged before scheduled slot. Below 100% = techs waiting for parts, capacity wasted.
Scheduled slots that didn't complete on planned day. Above 10% = scheduling too tight or capacity model wrong.
Move from Level 3 to Level 4 and cut roadside events roughly in half within one quarter — create your free account in 10 minutes.
5 Common Scheduling Failure Patterns
Five patterns that turn good PM programs into missed-compliance disasters. All five are scheduling-model failures, not checklist failures:
Shop Booked 100% With PMs, No Repair Slack
Pattern: Shop fills weekly capacity 100% with PMs. First unplanned repair pushes a PM to next week. Cascade begins — every subsequent repair pushes another PM. Compliance drops below 80% within 3 weeks. Reserve 25-30% for repairs from the start.
No Written Conflict Rule Between Dispatch and Shop
Pattern: PM trigger fires while truck is on load. Nobody has authority to make the call — dispatch pushes to next week, shop pushes to today, both wait for fleet manager. Truck stays on load past trigger. Written decision tree pre-agreed removes the escalation.
Parts Not Pre-Staged on Monday
Pattern: Truck arrives for PM-B. Tech starts work, discovers a required part not in stock. Truck sits half-assembled while parts ordered. 45-minute PM becomes 2-day PM. Kit-pull on Monday for the week catches missing parts in time to order.
PM Trigger Report Not Shared With Dispatch
Pattern: Shop knows what's due. Dispatch doesn't. Dispatch books trucks on 4-day lanes with PMs falling due mid-trip. Shared trigger visibility Monday morning prevents 80% of these conflicts before they happen.
No Friday Retrospective
Pattern: Scheduling problems repeat week after week because nobody reviews what actually happened vs planned. 15-minute Friday retro tracking PM compliance %, slippage %, and capacity utilization surfaces the pattern in week 2 instead of week 12.
Frequently Asked Questions
What PM compliance rate should a fleet target?
95%+ to trigger. Fleets below 80% see 2-3x the roadside breakdown rate of fleets above 95% — the missed PMs directly become the roadside events.
How should shop capacity be split between PMs and repairs?
Roughly 60-65% booked for scheduled PMs, 25-30% reserved for repair queue, 5-10% flex/buffer. Anything above 75% PM allocation eliminates room for repairs and causes cascading slippage.
Who wins when a PM triggers while truck is on active dispatch?
Pre-agreed decision tree wins — not the person shouting loudest. Standard rule: past 105% trigger = pull immediate; near a partner shop = route en route; within 72 hr of terminal = schedule for return.
Why do most scheduling models fail?
Two reasons: no capacity reserved for repairs (so any unplanned work pushes PMs), and no written conflict rule between shop and dispatch (so every conflict escalates).
What's the ROI of moving from Level 3 to Level 4?
PM compliance typically jumps from 80-88% into the 92-96% range within one quarter. Roadside breakdown rate cuts roughly in half. Shop capacity utilization stays flat or improves because parts-not-in-stock waste drops.
How does Truck Inspection & Maintenance handle scheduling?
Weekly capacity model with PM/repair/flex slot allocation, auto-triggered PMs on mileage + hours, conflict-resolution decision tree on shared calendar, parts pre-stage workflow, Monday-through-Friday scheduling rhythm built-in. Free forever for up to 3 vehicles — sign up in 10 minutes or contact us.
PM compliance isn't a checklist problem. Fix the calendar model and 95%+ compliance follows.
Weekly capacity grid with reserved repair slots, PM auto-triggers, conflict-resolution decision tree, parts pre-stage, 6 scheduling KPIs. Free forever for up to 3 vehicles — no hardware, no contract, no credit card.