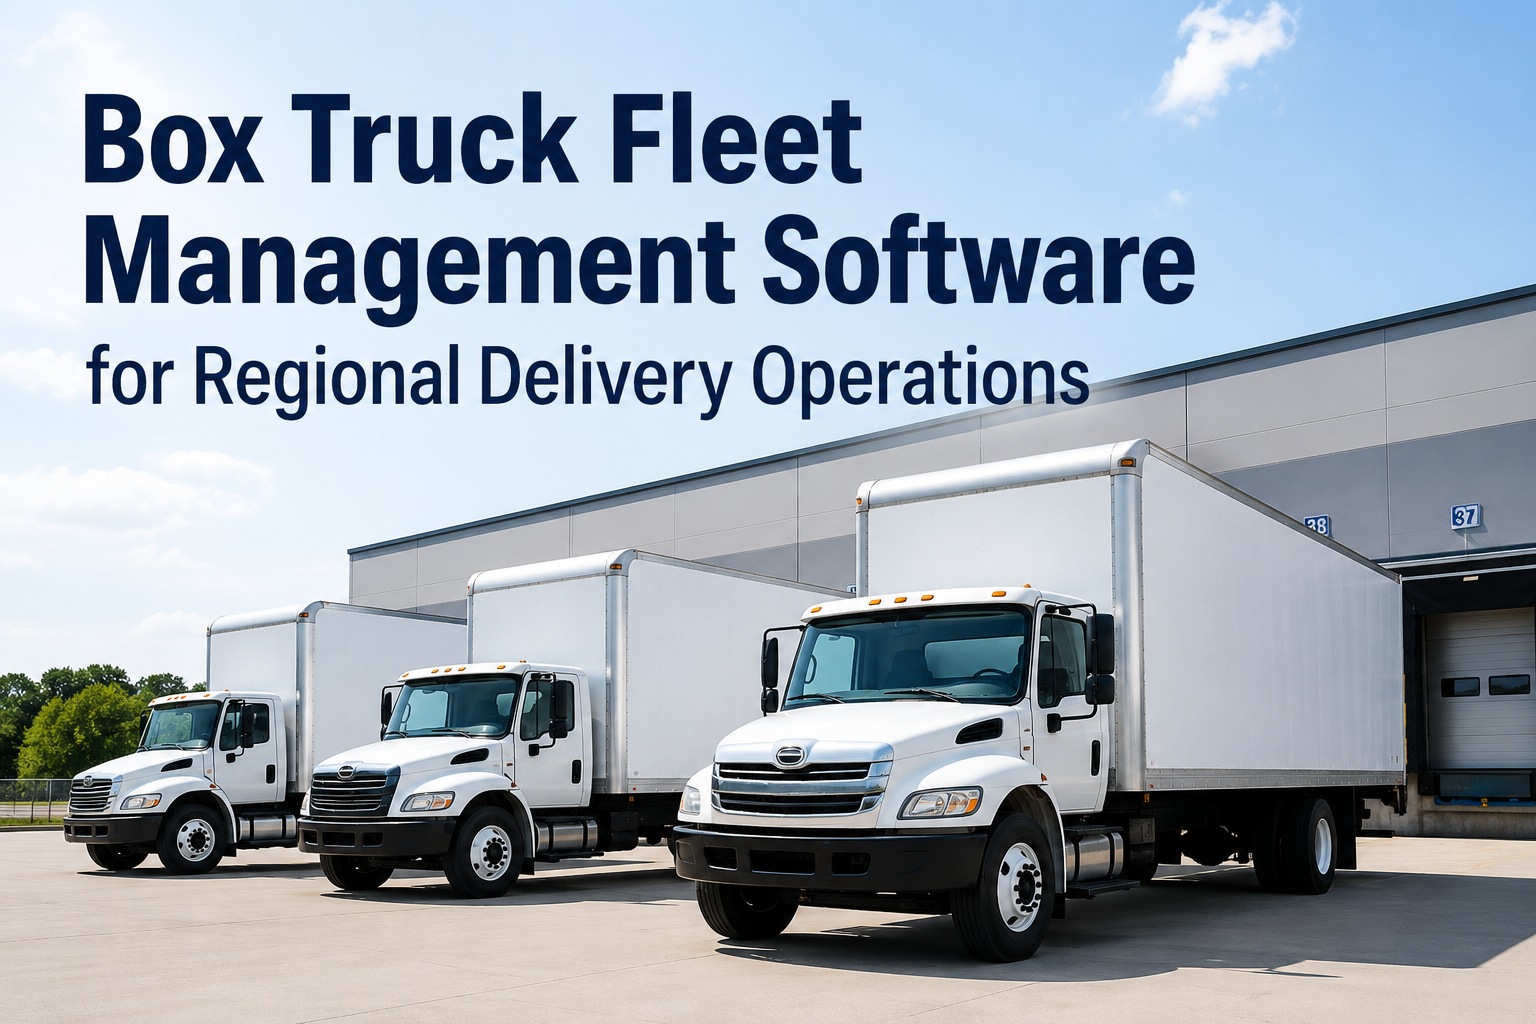
Box trucks live a different operational life than long-haul tractors — and that difference is exactly why most fleet software fails them. A 26-foot straight truck running regional delivery makes 30-60 stops a day, navigates urban load zones, deals with non-CDL and CDL drivers in the same fleet, racks up brake and tire wear at 3-4x the rate of highway miles, and operates inside customer delivery windows measured in 15-minute slots. Per Ryder's 2026 outlook, freight is regionalizing — nearshoring and micro-fulfillment are driving more frequent trips and tighter windows. Per Truck data, predictive maintenance cuts box truck breakdowns 35-40% and maintenance costs 50-60% — uptime climbs from 87% baseline to 94-96%. Truck Inspection & Maintenance is built for the operational reality of straight-truck fleets: multi-stop routing, urban duty-cycle PM intervals, driver performance per stop, customer ETAs, and DOT compliance for 26,001+ GVWR units. Start your free trial and run regional delivery on a platform built for it.
Box Truck Fleet Management Software
For 16ft to 26ft straight-truck fleets running multi-stop regional and last-mile delivery operations.
Long-Haul vs Regional Delivery — Why Box Trucks Need Different Software
Long-haul fleet software optimizes for fuel, HOS, and lane efficiency. Box truck fleets optimize for stops per day, on-time rate, and customer experience. The metrics are different, the wear patterns are different, and the compliance overhead is different. Truck Inspection & Maintenance is built for the second operational profile:
Highway-First Operation
Stop-First Operation
The 5 Critical Operational Metrics for Box Truck Fleets
Five metrics tell you whether a box truck fleet is healthy or bleeding margin. Top operators track these weekly per asset and per driver — not monthly. Truck Inspection & Maintenance surfaces all five on one dashboard so trends become visible before they become problems:
Stops Per Truck Per Day
The single biggest profitability lever. Below 30 = under-routed. Above 60 = driver burnout risk. Sweet spot scales with stop density and dwell time.
On-Time Delivery Rate
Customers measure this every shipment. Below 90% triggers customer-success calls; below 85% loses contracts. Live ETAs and dispatch agility move the number.
Cost Per Delivery
All-in: fuel + driver + truck cost ÷ stops completed. Dropping from $14 to $11 across a 25-truck fleet recovers six figures annually.
First-Attempt Delivery %
Failed deliveries (recipient absent, wrong address, refused) cost the same as completed ones. Address validation and customer notifications drive this metric.
Unplanned Downtime %
Hours off-road ÷ scheduled hours. Box trucks at 94-96% uptime with predictive PM; reactive fleets sit around 87%. Eight points = real money.
Stops Per Mile Driven
Density metric. Higher = better route optimization. Below 0.12 signals routing inefficiency or expanded territory without added trucks.
The Multi-Stop Routing Math — Cost Per Stop Visualized
Every stop carries a fixed cost — driver minutes, fuel, vehicle wear — that shrinks as stops per route grow. The math is non-linear: doubling stops from 20 to 40 cuts cost per stop by more than half. Truck Inspection & Maintenance tracks this per route so dispatch sees the impact live:
Built for stops, not just miles.
Truck Inspection & Maintenance handles multi-stop dispatch metrics, driver scorecards per stop, urban-cycle PM intervals, customer delivery proof, and DOT compliance for 26,001+ GVWR straight trucks. Free for up to 3 vehicles. Contact support to plan your rollout.
The Driver Scorecard — What Top Box Truck Fleets Track Weekly
For long-haul fleets the driver scorecard is fuel efficiency and HOS compliance. For box trucks it's stops, on-time, customer experience, and inspection discipline. Different operation, different scorecard. Truck Inspection & Maintenance grades drivers on what actually moves regional-delivery profitability:
Stops Completed Per Shift
Total deliveries finished within shift. Top drivers consistently exceed daily target; bottom quartile lags 25-30% behind on the same routes.
On-Time Stop %
Deliveries hitting the customer window. Driver behavior matters as much as routing — pace, dwell time, and route adherence all show up here.
POD Scan Compliance
Proof-of-delivery scans per stop. Missed scans = billing disputes downstream. Target 100% scan rate, real-world floor is 95%.
Pre-Trip Discipline
DVIR completion rate, defect catch rate, photo evidence quality. Predicts breakdown risk on that driver's truck weeks before failure.
Hard-Brake Events / 100 mi
Urban driving generates braking events naturally; aggressive driving multiplies them. Target under 4/100 mi for box truck duty cycles.
Customer Rating Avg
Recipient feedback per stop where collected. Driver soft skills directly affect customer retention and contract renewals.
The Box Truck PM Schedule — Why Urban Duty Cycle Changes Everything
Manufacturer PM intervals assume mixed-duty operation. Box trucks running urban routes hit those intervals far faster — brakes, tires, suspension, and aftertreatment all wear at city-driving rates, not highway rates. Truck Inspection & Maintenance schedules by duty cycle, not OEM default:
The Regional Delivery ROI Stack — 25 Box Trucks, Year 1
Box truck fleet ROI is unusually measurable because every operational lever — stops/day, on-time %, downtime, cost/delivery — has a direct dollar value. Year 1 numbers for a 25-truck regional delivery operation hitting moderate (not aggressive) targets:
Frequently Asked Questions
Why do box trucks need different software than long-haul tractors?
Different operational profile — regional delivery is stop-driven (30-60 stops/day, 120-200 miles), while long-haul is mile-driven (500-700 miles, few stops). The metrics that matter differ (stops/day, on-time, cost per delivery vs fuel/mile, MPG, HOS), the wear patterns differ (urban brakes/tires wear 3-4x faster), and the driver mix differs (mixed CDL/non-CDL on 26,001 GVWR line). Software built for one operation undersells the other.
Does it handle non-CDL drivers on smaller straight trucks?
Yes — driver profiles support both CDL Class A/B and non-CDL operators with the right certifications, medical cards, and qualification files tracked per driver. The platform enforces the right inspection workflow per vehicle class, and DOT compliance rules apply automatically for 26,001+ GVWR units. Sign up free to configure your first 3 trucks.
What's the ROI for a small box truck fleet?
For 25-truck regional fleets, Year 1 impact lands around $420K when stops/day improve, unplanned downtime drops to industry-leading levels, and maintenance shifts from reactive to duty-cycle-based PM. Smaller fleets see proportionally similar gains — every extra stop per day per truck is direct revenue at a fixed cost base.
How does PM scheduling differ for urban box trucks?
Significantly. Urban duty cycles wear brakes, tires, suspension, transmission, and DPF systems at roughly 2x the rate of highway operation. PM intervals scheduled by miles alone over-service highway-heavy trucks and under-service urban-heavy ones. The platform schedules by engine hours plus mileage plus duty cycle so every truck gets serviced when its specific wear rate demands.
Can it handle multi-stop routing for last-mile delivery?
Yes — multi-stop routing, customer ETAs, proof-of-delivery scans, time-window enforcement, and driver scorecards per stop are all built in. Customer notifications go out automatically; POD photos and signatures attach to the delivery record; failed-attempt tracking surfaces address quality issues per route.
How long does implementation take?
Most regional delivery fleets are running live in 1-2 weeks. Setup includes loading vehicles, drivers, customer addresses, route templates, and inspection workflows. Driver training takes about 15-20 minutes; dispatcher onboarding runs a few hours in parallel with existing routing for the first week. Talk to our team for a delivery-specific implementation walkthrough.
Run regional delivery on software built for it.
Truck Inspection & Maintenance handles multi-stop routing, urban-cycle PM, driver scorecards per stop, customer ETAs, proof of delivery, and DOT compliance for box-truck and straight-truck fleets. Free for up to 3 vehicles. No hardware. No contracts.