An electric truck almost always costs more on the day you buy it — and less on nearly every day after. That single fact is why comparing sticker prices is the most expensive mistake a fleet can make about electrification. The purchase price is just one line in a much longer ledger, and the operating phase — fuel, maintenance, insurance — typically accounts for 70-80% of a vehicle's lifetime cost. When you count all of it the picture flips: electricity runs a fraction of diesel per mile, EVs shed most routine maintenance, and the upfront premium is usually erased within a few years. Total cost of ownership is the number that actually matters, because it's where the savings hide that the sticker price conceals. This guide breaks down the full TCO equation, the breakeven curve, the per-mile numbers that decide it, the battery question everyone worries about, and the hidden costs to plan for — plus how fleet management software tracks the real cost per mile across a mixed fleet.
Fleet Electrification Guide · EV Total Cost of Ownership · 2026
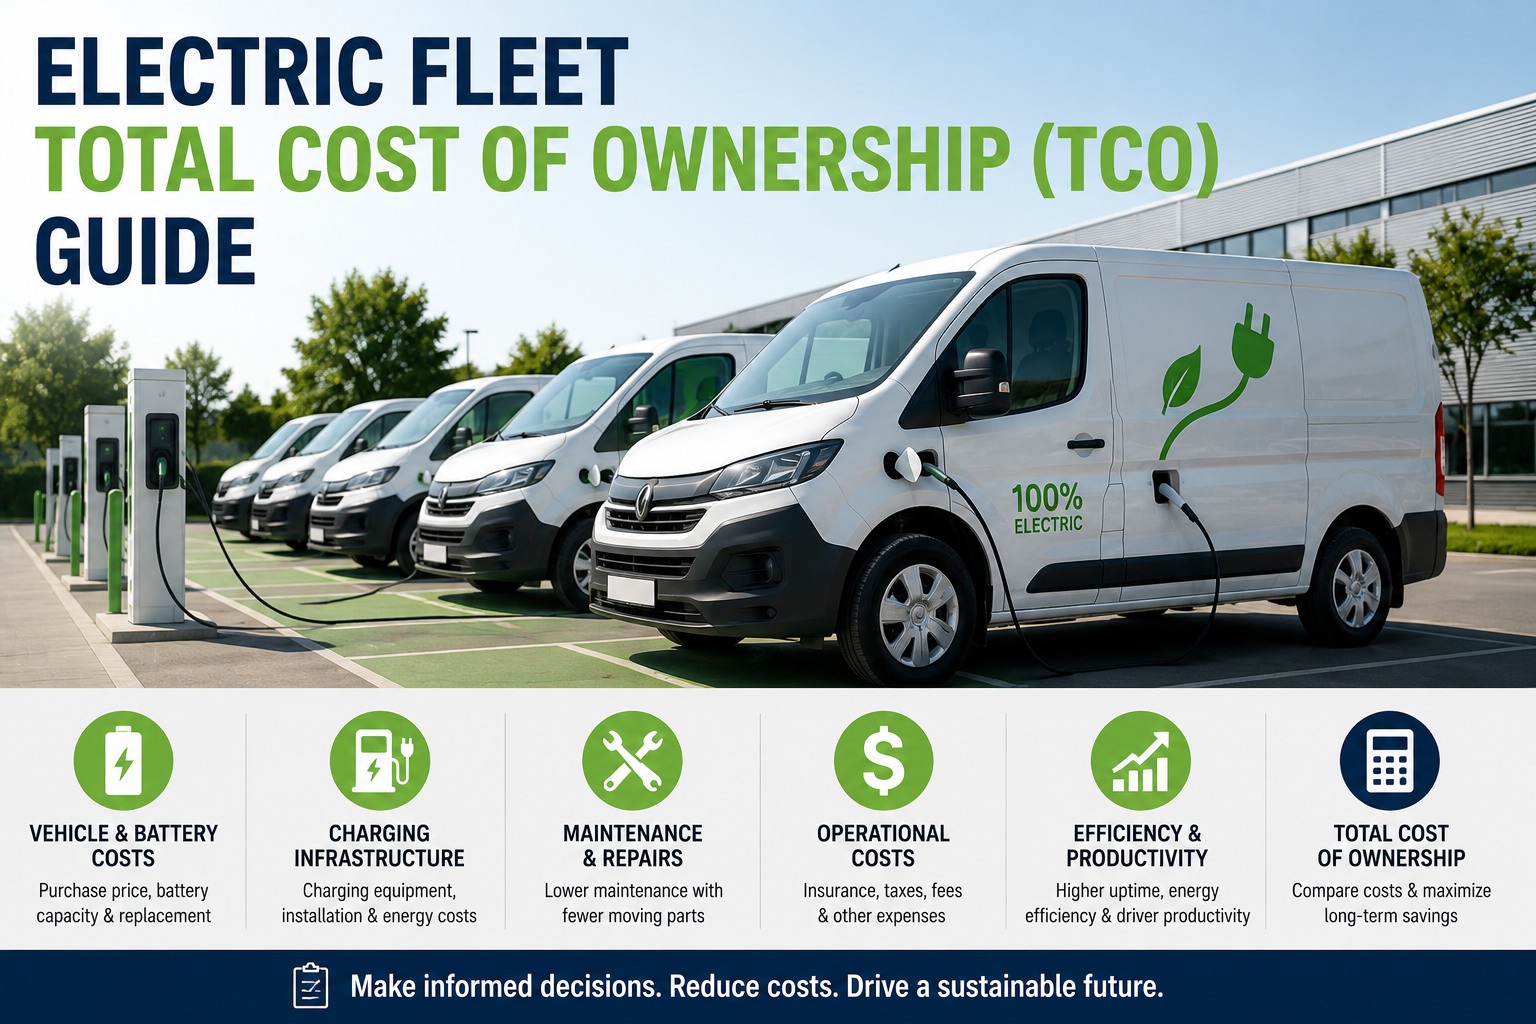
Electric Fleet Total Cost of Ownership (TCO) Guide
Why the sticker price lies, where electric fleets actually save, and how to know when an EV beats diesel on the only number that counts — lifetime cost.
60-80%
Lower fuel cost per mile than diesel
30-50%
Lower maintenance cost than diesel
2-4 yrs
Typical payback on the upfront premium
70-80%
Of lifetime cost is the operating phase
What TCO Actually Includes
Total cost of ownership is the complete lifetime cost of a vehicle, not its purchase price. A real analysis nets the things that cost you against the things that save you — and going beyond the sticker is the whole point:
Why this matters: most quick ROI calculators compare only purchase price and fuel. But the categories where EVs win — energy and maintenance — are larger and compound every mile, while the categories where diesel wins are mostly one-time upfront costs. Counting all seven categories is what makes TCO favor electrification for most commercial duty cycles.
The Breakeven Curve
The heart of every EV TCO story is a crossover. Diesel starts cheaper because the truck costs less. But its higher fuel and maintenance costs accumulate faster, and at some point the cumulative lines cross — after which the EV pulls steadily ahead for the rest of its life:
Where breakeven lands depends on the route: high-mileage urban and regional duty cycles cross fastest — sometimes 2-3 years — because they burn the most fuel and use regenerative braking heavily. Heavier trucks and long-haul take longer, often 4-6 years. As a rule, EVs deliver 20-30% lower five-year TCO for most routes under about 300 miles.
Where the Money Moves
Electrification doesn't make every cost go down — it shifts costs between categories. Understanding which way each one moves is how you judge whether the trade works for your fleet:
EVs cost $10,000-$30,000 more for light and medium trucks, and $50,000-$100,000+ for heavy-duty — though the premium keeps shrinking as battery prices fall.
Electricity runs roughly $0.03-$0.07 per mile against diesel's $0.12-$0.25 — a 60-80% cut, and the largest single TCO advantage. It compounds every mile driven.
Around 20 moving drivetrain parts versus 2,000+ in a diesel — no oil, no transmission service, no emissions aftertreatment, minimal brake wear. Costs drop 30-50%.
Depot charging installation runs $5,000-$50,000+ per location — a one-time cost that amortizes across every vehicle and every year of operation.
State and utility programs can cut costs substantially — some heavy-truck vouchers reach up to $60,000 per vehicle — meaningfully offsetting the purchase premium.
The Per-Mile Reality
Strip away the complexity and two numbers decide most TCO outcomes: what it costs to move the truck a mile, and what it costs to keep it running a mile. On both, the gap is decisive:
Energy cost per mile
Maintenance cost per mile
What that adds up to: at 100,000 miles a year, the fuel gap alone saves roughly $10,000-$20,000 per truck annually, and a regional-haul truck can save around $30,000 a year in fuel and maintenance combined. Over a 500,000-mile service life, the maintenance difference alone can top $40,000 per truck. This is the compounding that erases the upfront premium.
Free · Up to 3 Vehicles
Track your real cost per mile
Fleet management software captures energy use, maintenance spend, and downtime per vehicle — so you can see actual cost per mile for your EVs and diesels side by side, not just projections. Watch the breakeven arrive in your own numbers, catch maintenance issues early, and keep every asset's lifetime cost in one dashboard. Sign up free for up to 3 vehicles and put real data behind your electrification decisions.
The Battery Question
The cost that worries fleets most is the one that's changed the most. Battery replacement was once the specter that broke EV math — but the numbers have moved dramatically in electrification's favor:
Prices fell off a cliff
Battery pack costs dropped roughly 89% between 2010 and 2022 to around $139 per kWh, with further declines projected toward $70 per kWh by 2030 — reshaping the entire equation.
Packs increasingly last the vehicle
Modern battery packs are engineered to last the truck's service life, and manufacturer warranties commonly run 8-10 years or 100,000+ miles — so replacement often never enters the ownership window.
Degradation is gradual, not sudden
Batteries lose capacity slowly and predictably — a few percent a year — rather than failing outright, and optimized charging can extend their life 20-30%.
Residual value is emerging
Even at end of vehicle life, packs retain value for second-life energy storage and recycling, adding a residual line diesel simply doesn't have.
The Hidden Costs to Plan For
An honest TCO analysis doesn't only count the wins. A few costs catch unprepared fleets, and planning for them is the difference between a projection that holds and one that doesn't:
Make-ready electrical work
The surprise isn't the vehicle — it's the electrical installation. Bringing enough power to a depot can dwarf the charger hardware itself, and utility upgrades carry long lead times.
Demand charges
Unmanaged charging spikes peak power draw and inflates the electricity bill. This is an operating cost that smart scheduling controls — but only if it's planned for from the start.
Transition downtime
Poorly sequenced rollouts strand vehicles waiting on chargers that aren't energized yet. The same conversion can cost far more or less based purely on sequencing and site design.
Residual-value uncertainty
The used-EV market is still maturing, so resale values are less predictable than diesel's — a real variable worth modeling conservatively.
Where EV Wins Today — and Where It Doesn't Yet
TCO isn't uniform across every route. The honest answer is that electrification already wins decisively in some applications and is still approaching parity in others:
Urban & regional delivery
City and regional routes under about 300 miles already favor electric — often 15-57% lower per-mile costs — thanks to heavy regenerative braking, overnight depot charging, and high daily mileage that maximizes fuel savings.
Long-haul & heavy-duty
Long-haul is the harder case, with big battery packs adding significant upfront cost. Industry projections put total cost parity for heavy-duty electric trucks around 2026-2028 as battery prices keep falling and ranges improve.
The trend is one direction: tightening emissions standards and steadily falling battery costs are pulling the breakeven point earlier every year. Even segments that aren't at parity today are on a clear trajectory toward it — which is why many fleets model TCO over the full ownership horizon, not just today's prices.
Frequently Asked Questions
What is electric fleet total cost of ownership?
TCO is the complete lifetime cost of owning and operating a vehicle — purchase price, charging infrastructure, energy, maintenance, and insurance — minus incentives, fuel savings, and residual value. It compares those lifetime costs against diesel to reveal the true financial impact of electrification, going well beyond a simple purchase-price comparison. For most commercial duty cycles, EV TCO comes out lower despite the higher sticker price.
How long until an electric truck pays for itself?
Typically 2-4 years for the upfront premium to be erased by fuel and maintenance savings, and as little as 2-3 years for high-mileage urban and regional routes. Heavier trucks and long-haul applications take longer, often 4-6 years. The payback is faster the more miles a truck drives, because the per-mile savings are where EVs win. Contact our team to model your fleet's payback.
How much cheaper is an EV to run per mile?
Substantially. Electricity costs roughly $0.03-$0.07 per mile versus $0.12-$0.25 for diesel — a 60-80% reduction that is the single largest TCO advantage. Maintenance is also 30-50% lower, at about $0.04-$0.14 per mile against diesel's $0.08-$0.22. At 100,000 miles a year, the combined savings can reach around $30,000 per truck annually for regional-haul operations.
What about battery replacement costs?
This is the most over-worried cost. Battery prices have fallen roughly 89% since 2010, modern packs are engineered to last the vehicle's service life, and warranties commonly run 8-10 years or 100,000+ miles — so replacement often never occurs during ownership. Batteries also degrade gradually rather than failing suddenly, and even retired packs hold residual value for second-life storage and recycling.
What hidden costs should I plan for?
The big ones are make-ready electrical work (often larger than the charger hardware and subject to long utility lead times), demand charges from unmanaged charging, transition downtime from poorly sequenced rollouts, and residual-value uncertainty in a still-maturing used-EV market. None of these break the TCO case, but ignoring them turns an accurate projection into an optimistic one. Modeling them upfront is essential.
Does EV always beat diesel on TCO?
Not universally — it depends on the route. Urban and regional delivery under about 300 miles already wins decisively, with 15-57% lower per-mile costs in city applications. Long-haul and the heaviest trucks are approaching parity, projected around 2026-2028 as battery costs fall and range improves. The direction is consistent: breakeven keeps moving earlier, so modeling TCO over the full ownership period is the right approach. Sign up free to track it with real data.
Decide on the Number That Matters
See lifetime cost per mile, not just the sticker price.
Fleet management software tracks energy, maintenance, and downtime per vehicle across EVs and diesels together — turning TCO from a spreadsheet projection into live cost-per-mile data you can act on. Watch breakeven arrive in your own fleet, catch issues before they cost you, and make electrification decisions on evidence. Free for up to 3 vehicles. Works with your existing telematics, no contracts.