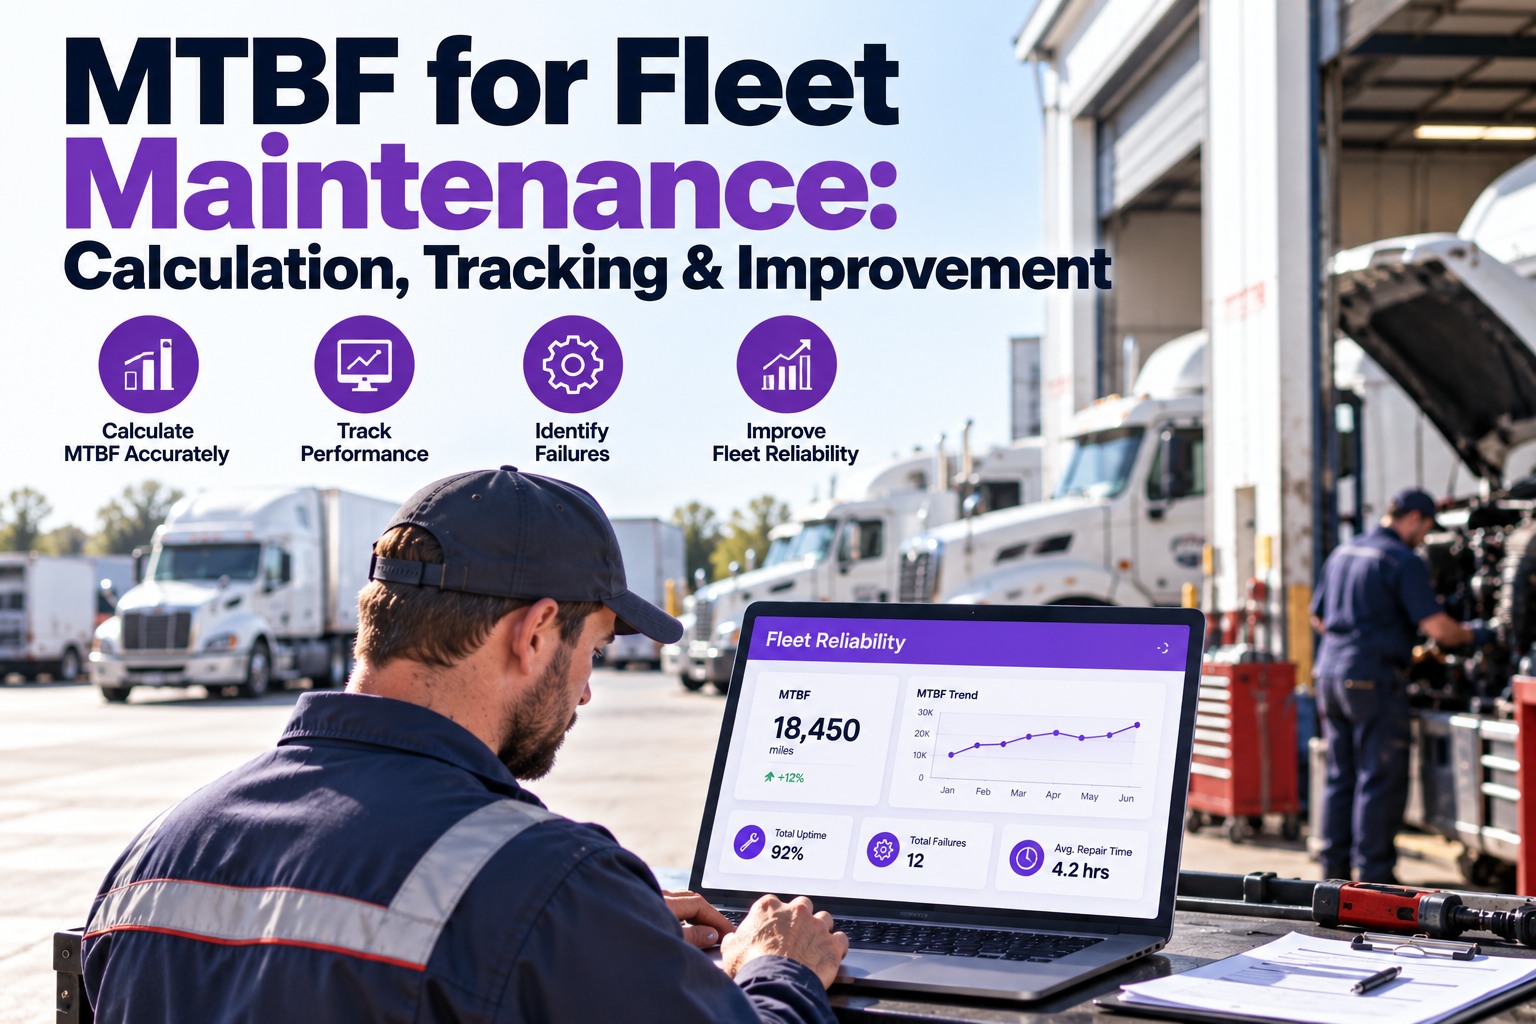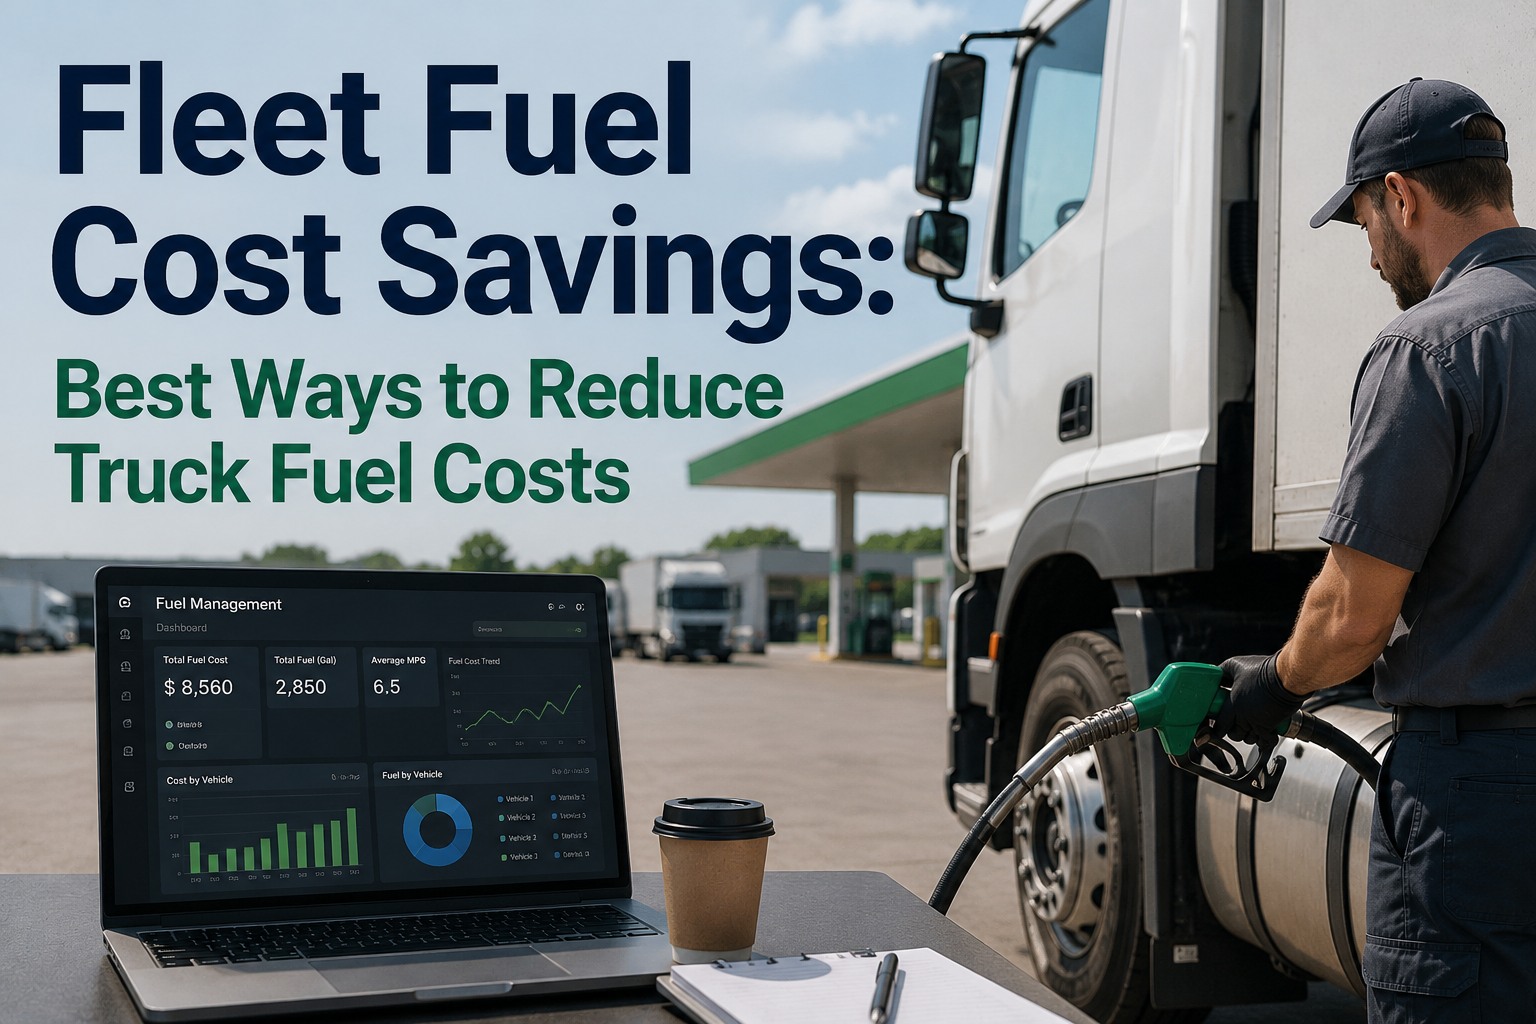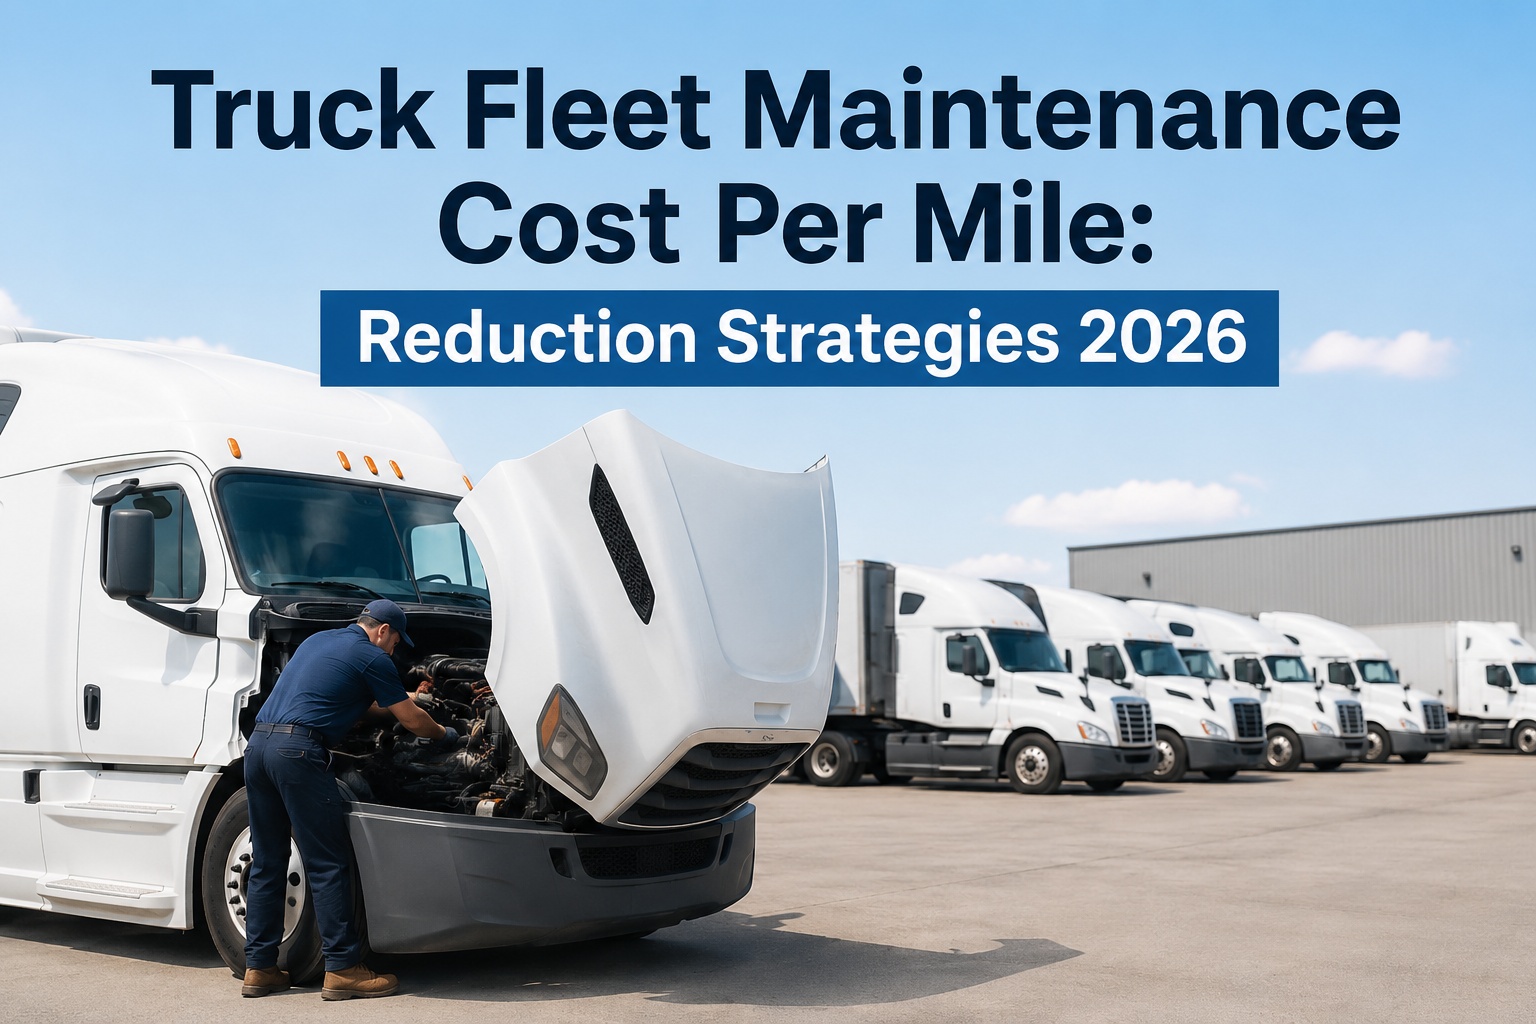
If you can't measure it, you can't manage it — and most fleet managers can't measure their actual maintenance costs. They know what hit the credit card last month. They don't know cost-per-mile by vehicle, planned-vs-unplanned ratio, parts spend by category, or which 20% of trucks are eating 80% of the budget. Industry data shows the average heavy-duty commercial truck costs $16,192 annually in repair and maintenance — up 3.7% year-over-year through Q4 2025. Maintenance represents $0.202 per mile or 8.9% of total fleet operating expenses according to ATRI's 2024 figures. Yet vehicles over 10 years old account for only 12% of fleet miles driven but consume 33.5% of total maintenance spend. Without cost tracking at the vehicle level, you can't see this concentration — and you can't act on it. Truck Inspection & Maintenance auto-captures every labor hour, every part, every vendor invoice at work order close — calculating cost per mile, cost per vehicle, and reactive-vs-planned spending in real time. Fleets running our platform report 25-35% maintenance cost reduction through visibility-driven optimization with 4-8 month payback. This guide walks through exactly how to track maintenance costs and what to do with the data. Talk to our team for a cost-tracking walkthrough.
How to Track Vehicle Maintenance Costs in Your Fleet
Every dollar accounted for. Truck Inspection & Maintenance auto-captures at work order close.
The 6 Cost Categories Every Fleet Must Track
Maintenance cost isn't one number — it's six distinct categories that each tell you something different. Truck Inspection & Maintenance captures all six per vehicle, per period, automatically:
In-House Labor
Technician hours × loaded labor rate. Time tracking integrated with work orders. Our platform captures wrench-time per repair, per tech, per vehicle — feeds labor efficiency analytics.
Outside Service
Dealer service, roadside assistance, third-party repair shops — typically 1.5-2x in-house labor rate. Truck Inspection & Maintenance flags outside work for cost-comparison vs in-house capacity.
Parts & Components
Filters, fluids, brake pads, tires, major components. Tariff-driven steel/aluminum increases (Section 232) flow through here. Our platform tracks parts spend by category and identifies bulk-buy opportunities (15-25% discounts).
Tire Costs (Separately)
Purchase + mounting + balancing + disposal. Tracked separate from other parts due to magnitude. Strong correlation with driver behavior — harsh braking shows up here first.
Fluid & Consumables
Oil, coolant, hydraulic fluid, washer fluid, grease. Small per-event but adds up. Truck Inspection & Maintenance auto-deducts from inventory at each PM.
Downtime Cost (Indirect)
$448-$760 per vehicle per day in lost revenue. Most fleets ignore this — biggest hidden cost. Our platform calculates downtime cost automatically from work order duration × revenue/hour.
The 6 Critical Cost KPIs to Calculate
Raw cost numbers are noise. KPIs are signal. Truck Inspection & Maintenance calculates all six in real-time dashboards — no spreadsheet exports required:
The Cost-Per-Mile Math — Why It Beats Total Spend
Raw maintenance cost is misleading because vehicles drive different miles. CPM normalizes everything to apples-to-apples comparison. Truck Inspection & Maintenance calculates CPM per vehicle automatically:
The insight raw numbers miss: Truck B has the lowest absolute cost but the highest CPM — it's actually the most expensive per unit of work. Truck C looks expensive at $22K but is the most efficient per mile. Without CPM tracking in Truck Inspection & Maintenance, you'd target the wrong vehicle for replacement.
The Data Capture Workflow
Cost tracking only works if data capture is friction-free. Truck Inspection & Maintenance auto-captures every cost component at the moment it happens — not later in a manual data entry pass:
Stop guessing what maintenance actually costs
Truck Inspection & Maintenance auto-captures labor, parts, vendor invoices, and downtime per vehicle at work order close. CPM dashboards, planned-vs-unplanned ratios, vendor spend analysis — all in real time. Sign up free to start tracking on 3 vehicles today.
2026 Cost Benchmarks — Where Should You Be?
A cost number without a benchmark is trivia. Truck Inspection & Maintenance shows your fleet against industry benchmarks automatically:
The benchmark gap: The difference between industry average and best-in-class is typically 30-45% in total maintenance cost. Most fleets don't realize where they stand because they've never measured. Truck Inspection & Maintenance surfaces the gaps worth closing first.
The 80/20 Rule — Where Costs Concentrate
In every fleet, 20% of vehicles generate 80% of maintenance cost. Truck Inspection & Maintenance surfaces this concentration automatically — and shows you exactly which units are the cost drivers:
The Integration Stack — What Talks to What
Cost tracking only works when data flows automatically between systems. Manual reconciliation = errors compound. Truck Inspection & Maintenance integrates with the systems holding your cost data:
QuickBooks Online + Desktop, Sage, Xero. Work orders auto-sync as bills/journal entries. Per-vehicle class tagging for full GL coding.
Geotab, Samsara, Motive, Verizon Connect. Live mileage and engine hours flow in for CPM calculation. No manual odometer entry.
WEX, Comdata, Fleetcor. Fuel transactions auto-import for fuel-cost-per-mile calculation alongside maintenance CPM.
NAPA, Fleet Pride, dealer parts portals. Invoice data imports for accurate cost capture at consumption.
Outside service bills uploaded or pulled via API. Costs auto-attach to specific work orders. Audit trail intact.
Technician hours captured per work order. Loaded labor rate (wages + benefits + overhead) auto-applied for true cost.
What Cost Tracking Enables — Decisions, Not Just Data
Real-time cost tracking exists to drive decisions. Truck Inspection & Maintenance surfaces the data; you make calls that compound monthly:
Frequently Asked Questions
Cost Per Mile (CPM) per vehicle. Industry benchmark: $0.12-$0.18 best-in-class, $0.20-$0.25 average, $0.30+ urgent intervention. CPM normalizes maintenance spending across vehicles with different usage patterns — allowing true apples-to-apples comparison. Truck Inspection & Maintenance calculates CPM per vehicle automatically every month with industry benchmarks built in. Contact our specialists for a CPM baseline assessment.
Industry average: $16,192 per heavy-duty commercial truck per year (Q4 2025 data), up 3.7% year-over-year. That breaks down to roughly $0.202 per mile and 8.9% of total fleet operating expenses. Truck Inspection & Maintenance benchmarks your fleet against these averages automatically and surfaces vehicles tracking 20%+ above benchmark for closer review.
For 5 or fewer vehicles, yes — discipline matters more than technology. Above 10 vehicles, spreadsheets break down: manual data entry creates errors, no real-time visibility, no per-vehicle drill-down, no automated benchmarking, no integration with parts/telematics/accounting. Truck Inspection & Maintenance auto-captures everything at work order close — eliminating the data entry problem entirely. Sign up free to test the difference on 3 vehicles.
Industry benchmark: above 65% planned spending. Best-in-class fleets achieve 80/20 (80% planned, 20% unplanned). The reason this metric matters: reactive repairs cost 3-9x more than the same work done preventively. Every 10% shift toward planned saves real money. Truck Inspection & Maintenance tracks this ratio automatically and surfaces the trend month-over-month.
Parts costs auto-import from supplier invoices via integration with NAPA, Fleet Pride, dealer portals. When a mechanic consumes a part, it's scanned at the work order — cost flows from invoice to vehicle history automatically. Inventory decrements in real time. Bulk-buy opportunities (15-25% discounts on commodity items) surface when consumption patterns become predictable. Steel/aluminum tariff impacts (Section 232) visible in trend reports.
Industry data: 25-35% reduction in total maintenance costs through visibility-driven optimization. Payback period: 4-8 months. The mechanism: spreadsheet-only fleets can't see where money leaks; CMMS platforms surface the leaks. Most fleets recover the cost of Truck Inspection & Maintenance multiple times in year one through better PM compliance, vendor negotiation, and replacement timing. Talk to our team for an ROI calculation specific to your fleet.
If you can't measure it, you can't manage it.
Truck Inspection & Maintenance auto-captures every labor hour, every part, every vendor invoice, every downtime minute at work order close. CPM dashboards. Planned-vs-unplanned ratios. Vendor spend analysis. Industry benchmarks built in. Free for up to 3 vehicles.