Fleet maintenance is typically the second-largest operating expense after fuel, running $0.15–$0.32 per mile depending on vehicle class, duty cycle, and fleet age. For a 25-truck fleet averaging 100,000 miles per truck per year, that's $375,000 to $800,000 in annual maintenance — and if you can't forecast it accurately, you can't control it. Yet a surprising number of fleets still run maintenance budgets on gut feel: they know last year's total, they know parts prices rose, they add 5% and call it planning. That approach guarantees budget overruns whenever a major failure happens, missed savings when maintenance-software ROI would have paid for itself, and no way to defend the maintenance line item when finance leadership questions it. A real fleet maintenance budget separates predictable PM costs from variable repair costs, forecasts by vehicle age and duty cycle, tracks the four KPIs that actually predict maintenance spend, and identifies the specific cost-reduction levers where a small investment returns 3–5x. This guide walks through the complete framework: what a fleet maintenance budget actually contains, how to build one in six steps, the KPIs to track monthly, the cost-reduction levers with the biggest payoff, and how software automates the tracking that makes budget accuracy possible. Ready to build a data-driven fleet maintenance budget? Start a free trial of our fleet maintenance software, or reach out to our support team for a walkthrough.
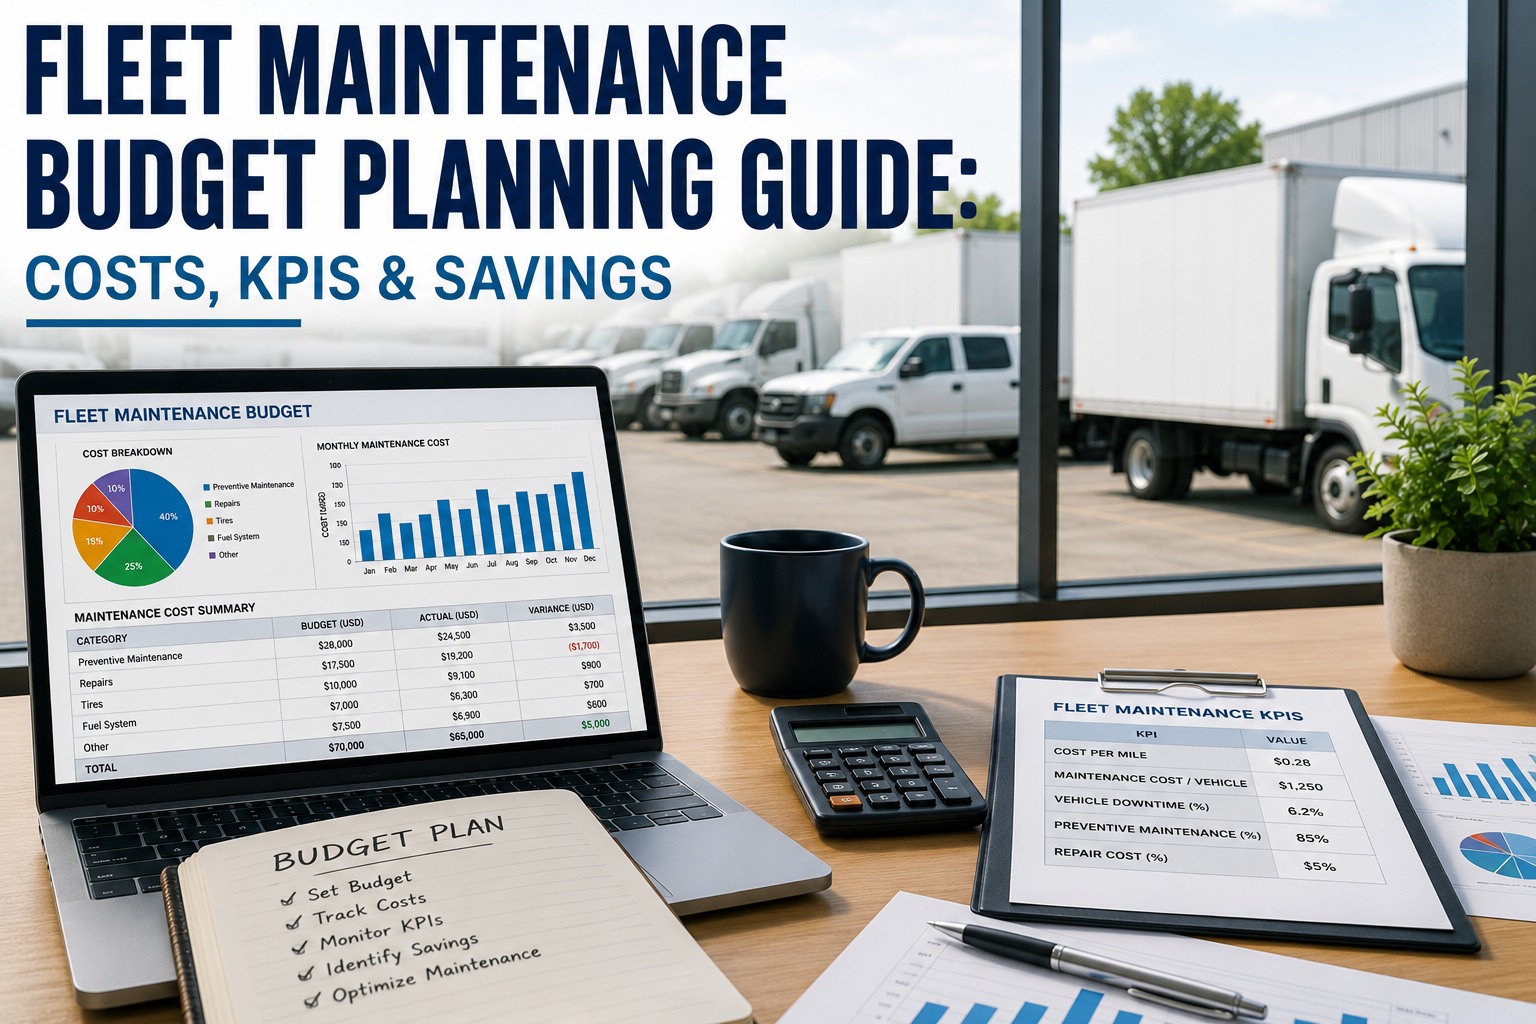
Fleet Maintenance Budget Planning Guide: Costs, KPIs & Savings
Build a defensible fleet maintenance budget with real forecasting, KPI tracking, and cost-reduction levers that pay back 3–5x — instead of adding 5% to last year's number.
What a Fleet Maintenance Budget Actually Contains
Before you can forecast or control fleet maintenance spend, you need to know what's inside it. Most budgets fail because they lump variable and fixed costs into one line — making it impossible to see where money is really going.
Cost Per Mile Benchmarks by Vehicle Class
Every fleet maintenance budget starts with cost-per-mile benchmarks. These are the industry norms — your fleet should be within ±15% of these numbers, and if not, either your fleet is unusual or your tracking is wrong.
The 6-Step Fleet Maintenance Budget Framework
A defensible fleet maintenance budget follows a specific process. Skip any step and the budget becomes unusable within a quarter — over-run in one area, under-spent in another, with no way to explain why.
Inventory Your Fleet Composition
List every vehicle by class, year, and expected annual mileage. Group by class since maintenance cost curves are different. Note vehicles approaching replacement age (7+ years) — they need higher reserve provisions.
Apply Cost-Per-Mile Baselines
Multiply each vehicle's expected mileage by its class's cost-per-mile benchmark. Adjust for vehicle age — years 1–2 get 60% of benchmark, years 5–6 get 100%, years 8+ get 130–140%.
Add Duty-Cycle Severity Multipliers
Delivery duty × 1.4, moving-company work × 1.6, dusty/off-road × 1.3, cold-climate × 1.15. Highway regional runs at baseline. Multiply the baseline forecast by the appropriate factor per truck.
Reserve for Major Components
Allocate 15–20% of the total as reserve fund for transmission, engine, and major component failures. Vehicles over 5 years get an additional 5% reserve.
Add Fixed Costs
Shop rent, tech wages, benefits, software licenses, tooling, uniforms. These are usually 10–15% of the variable total. Don't forget the invisible costs: DOT inspection fees, annual registration.
Budget Downtime & Recovery
Add 8–10% for downtime cost: rental replacements, towing, cascading operational impact. This is the most-missed line item in fleet budgets — and the one that generates the most overruns.
The 4 KPIs That Actually Predict Fleet Maintenance Spend
Fleet management software will track hundreds of metrics. Only four of them predict maintenance spend well enough to matter for budget accuracy. Track these monthly; ignore the noise.
Track every KPI across the fleet in one dashboard
Cost per mile per truck. PM compliance auto-calculated. Downtime tracked per vehicle. PM-to-repair ratio in real time.
The 6 Highest-Impact Cost-Reduction Levers
Fleet maintenance cost isn't fixed. Six specific interventions consistently reduce spend by 8–25% in the first year — but only if you know which ones apply to your fleet situation.
PM Compliance Discipline
Move from 75% to 95% on-time PM. Every 1% improvement in PM compliance reduces unplanned repair cost by roughly 3%. Software-enforced scheduling is the mechanism.
Fleet Replacement Timing
Retire vehicles at the economic replacement point (usually year 6–8) instead of running them to failure. Older trucks generate 2–3x the maintenance cost of new ones.
Driver Behavior Coaching
Hard braking, jackrabbit acceleration, and idle time all drive maintenance cost. Telematics-based driver scorecards reduce brake, tire, and drivetrain wear.
Parts & Vendor Consolidation
Negotiate volume pricing with 2–3 primary parts suppliers instead of ad-hoc buying. National account rates typically save 12–20% on parts.
In-House vs Outsource Analysis
Fleets over 50 vehicles usually save by bringing PM in-house; fleets under 25 usually save by outsourcing. The middle is a calculation, not an assumption.
Warranty Recovery Discipline
Fleets routinely eat repair costs that should be warranty-covered. Software-tracked warranty status and claim workflow recovers 3–8% of repair spend annually.
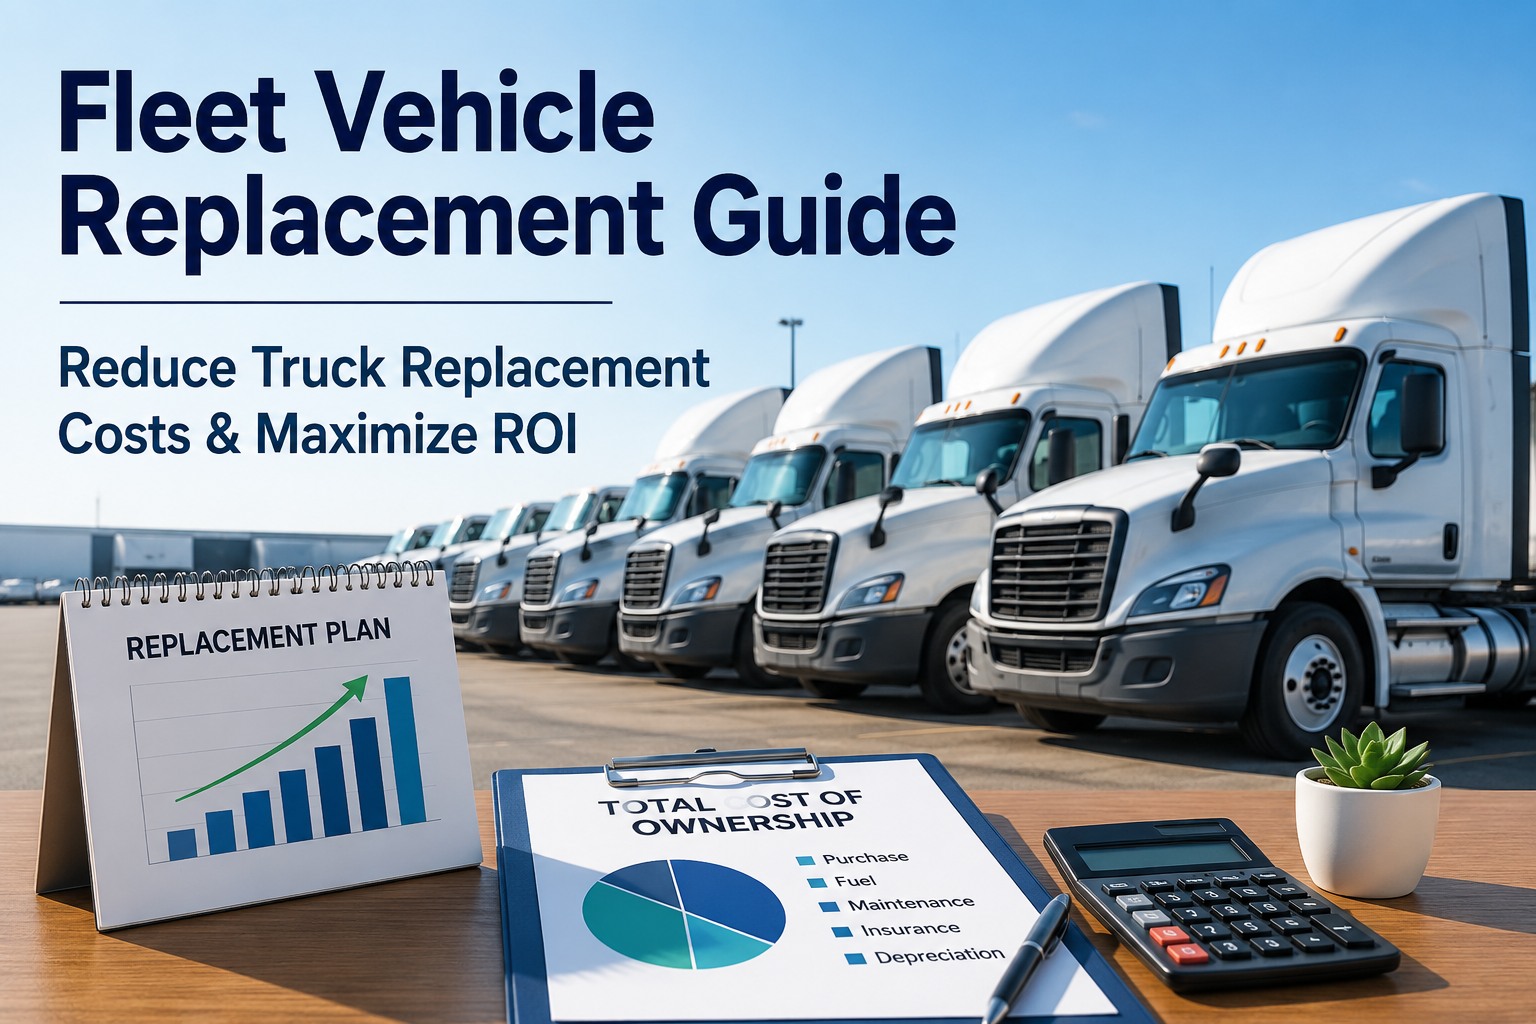
Total Cost of Ownership: The Whole Picture
Maintenance is one line in a larger TCO framework. Understanding TCO lets you make replacement decisions correctly and evaluate whether maintenance investment is paying off.
How Software Automates Budget Accuracy
Budget accuracy depends on tracking accuracy. Spreadsheets can't handle 25+ vehicles, hundreds of monthly service events, and real-time KPI calculation — which is why software has become the standard for any fleet over 15 vehicles.
Real-Time Cost-Per-Mile Tracking
Every service event costed and logged by VIN. Cost-per-mile per truck visible in real time. Outliers flagged before they become budget disasters.
Automatic PM Scheduling & Compliance
PM tasks generated per mileage thresholds. On-time completion tracked automatically. Compliance rate calculated and reported without manual effort.
Downtime & Reserve Tracking
Every out-of-service hour logged per vehicle. Downtime percentage calculated per truck and fleet-wide. Reserve fund draws tracked against budget in real time.
Warranty & Vendor Recovery
Component warranty status tracked by VIN. Recoverable repair costs flagged automatically. Vendor invoices matched against negotiated rates for overcharge detection.
Frequently Asked Questions
A complete fleet maintenance budget includes five categories: preventive maintenance (about 35% of total), wear parts and repairs (25%), reserve for major component failures (20%), labor and shop overhead (12%), and downtime/recovery costs (8%). Most fleets underbudget by 15–25% because they miss the downtime line — a $2,500 repair typically generates another $1,200–$2,000 in cascade costs. Track all categories in our fleet management software.
Cost per mile varies by vehicle class and duty cycle. Class 8 tractors typically run $0.17–$0.22 per mile. Class 6–7 medium trucks run $0.22–$0.30 per mile. Class 3–5 box trucks run $0.24–$0.32 per mile because of stop-and-go duty. Pickups and vans run $0.15–$0.22. Vehicle age also matters — years 1–2 run 60% of benchmark, years 5–6 hit 100%, and years 8+ climb to 130–140%.
Four KPIs actually predict maintenance spend well: Cost Per Mile (target within ±15% of class benchmark), PM Compliance Rate (target 95%+ on-time), Downtime Percentage (target below 5%), and PM-to-Repair Ratio (target 60/40 or better). PM Compliance is the leading indicator — below 90% predicts a repair-cost spike within 6 months. Everything else is noise for budget-accuracy purposes.
Six proven levers reduce fleet maintenance spend meaningfully: PM compliance discipline (12–18% savings), fleet replacement at economic life (8–15%), driver behavior coaching (6–12%), parts and vendor consolidation (5–10%), in-house vs outsource optimization (8–15%), and warranty recovery discipline (3–8%). These aren't additive but multiplicative — a comprehensive program frequently cuts total maintenance spend 20–30% over 24 months. Contact our team for a cost-reduction assessment.
The economic replacement point is where a new vehicle's TCO (including finance cost) becomes cheaper than continued maintenance on the old vehicle. For Class 6–8 commercial trucks this typically happens in years 6–8. For Class 3–5 box trucks in delivery duty, years 5–7. The trigger signal in the data: monthly cost per mile crosses 30% above class benchmark for two consecutive quarters. That means major components are approaching mean-time-to-failure and repair frequency will keep climbing.
Under 15 vehicles, a well-managed spreadsheet can work if someone owns it consistently. From 15 to 50 vehicles, software pays for itself within 3–6 months through better PM compliance and warranty recovery alone. Above 50 vehicles, spreadsheets fail — too many events, too many vehicles, no way to calculate KPIs monthly. Software typically returns 3–5x its cost through the six cost-reduction levers above. Try tracking for free: sign up here.
Defensible fleet maintenance budgets, every quarter
Cost per mile per truck. PM compliance tracked and enforced. Downtime measured per vehicle. Warranty recovery automated. Every service event costed by VIN. The KPIs that predict maintenance spend, the automation that reduces it, and the tracking that makes budget accuracy possible — one platform, one workflow.