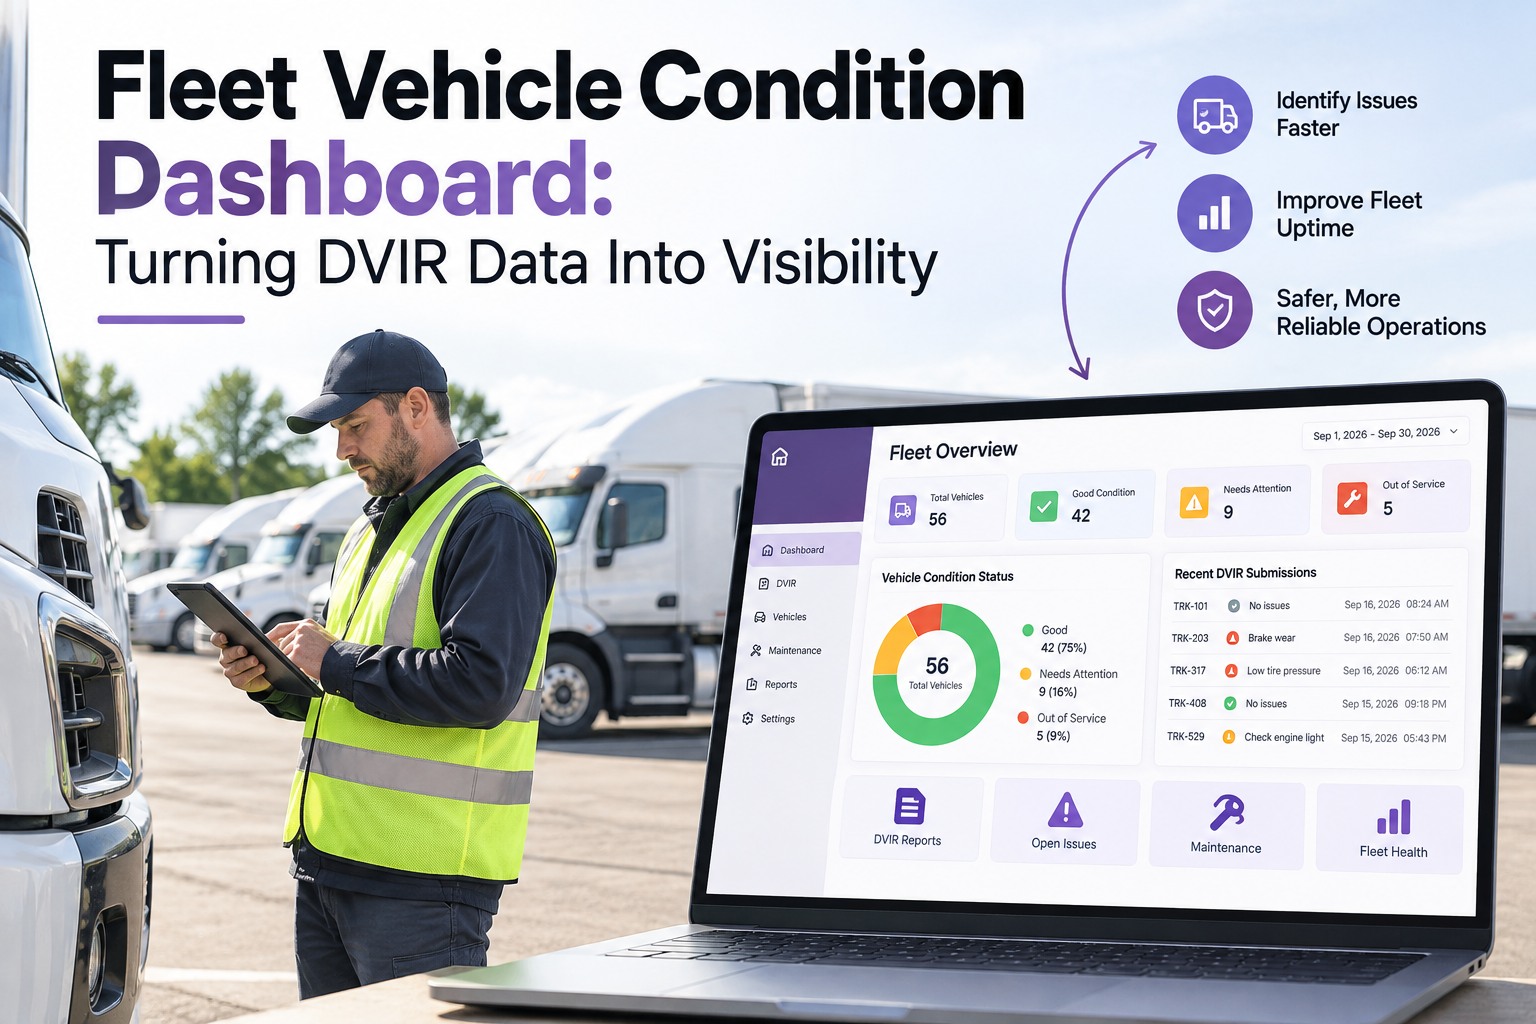
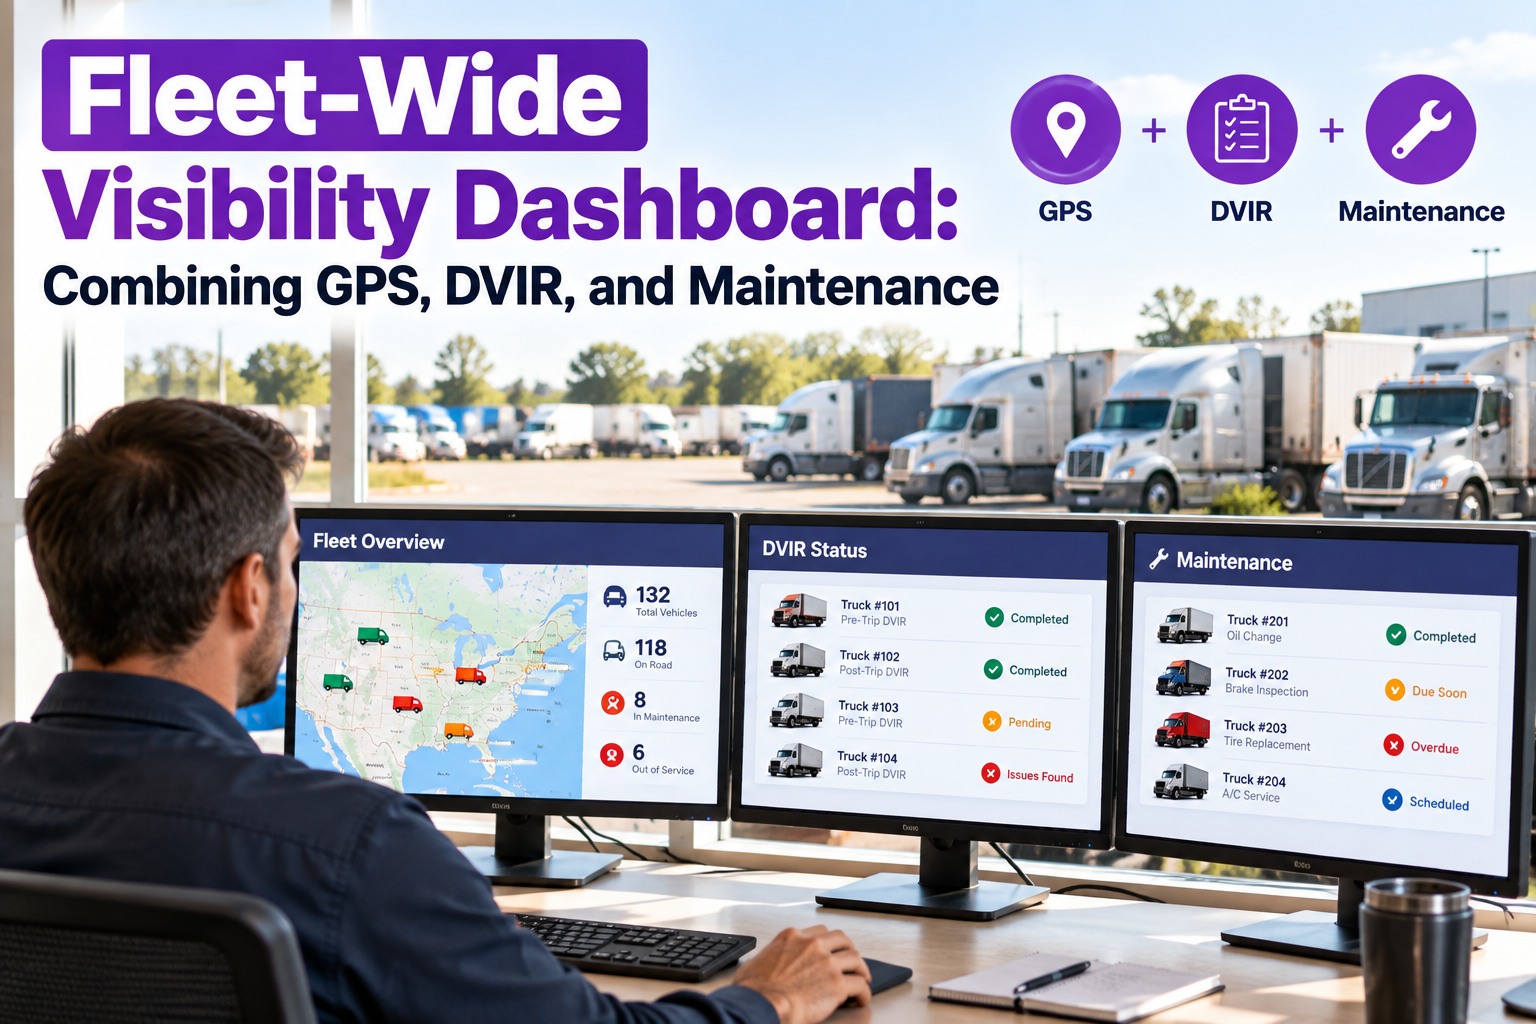
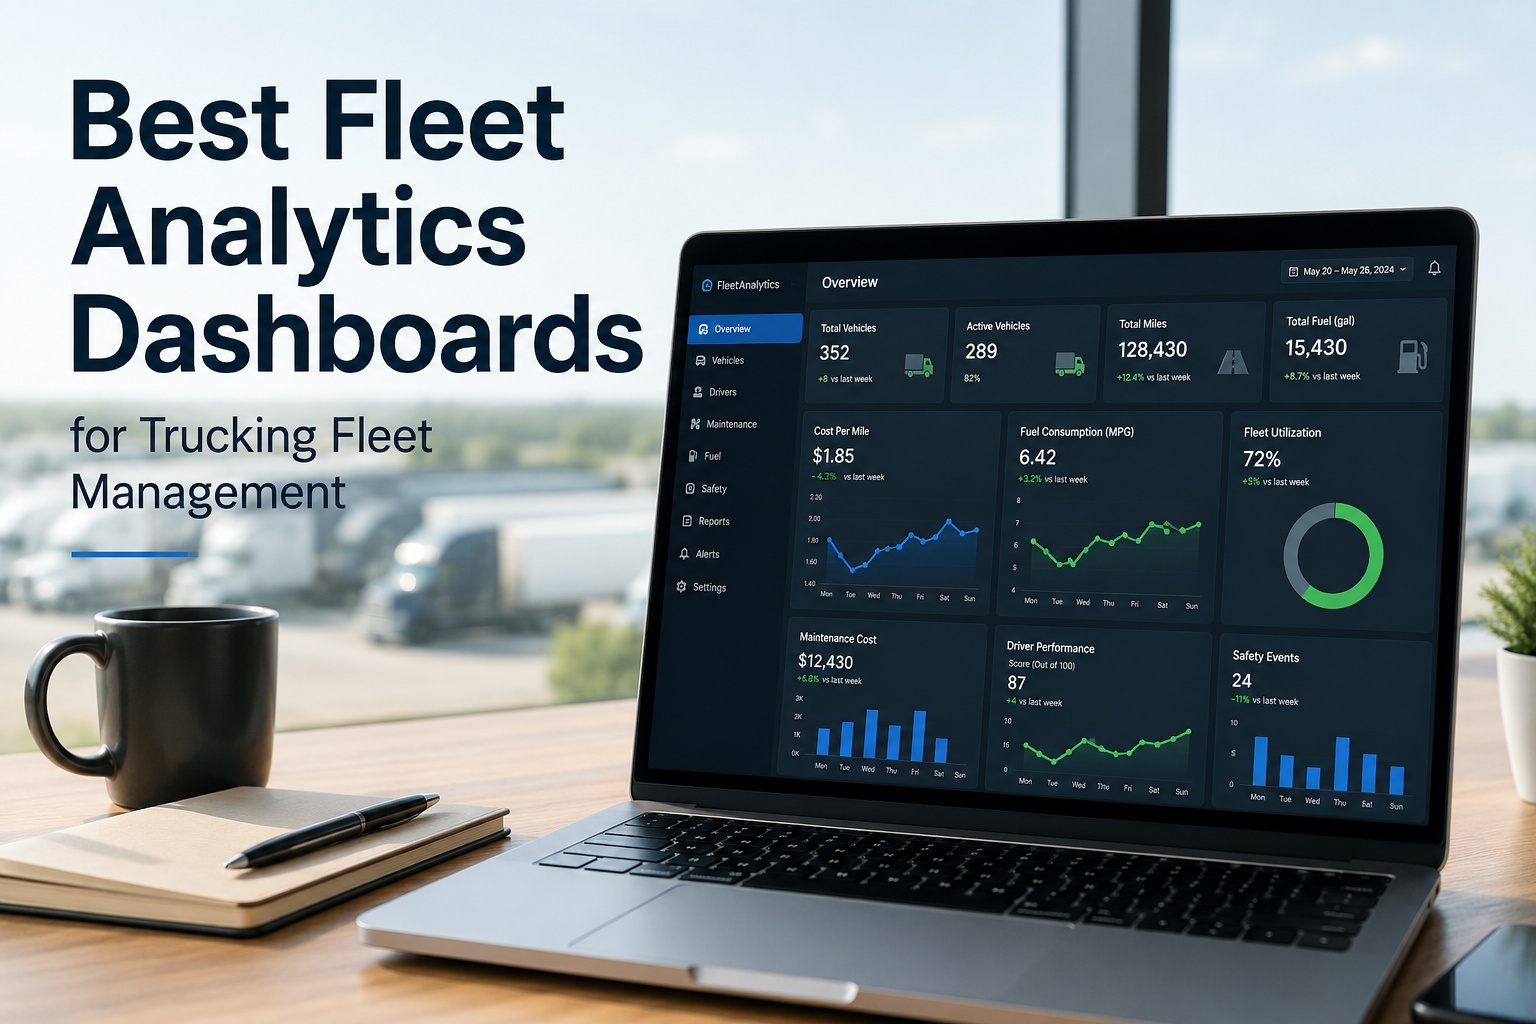
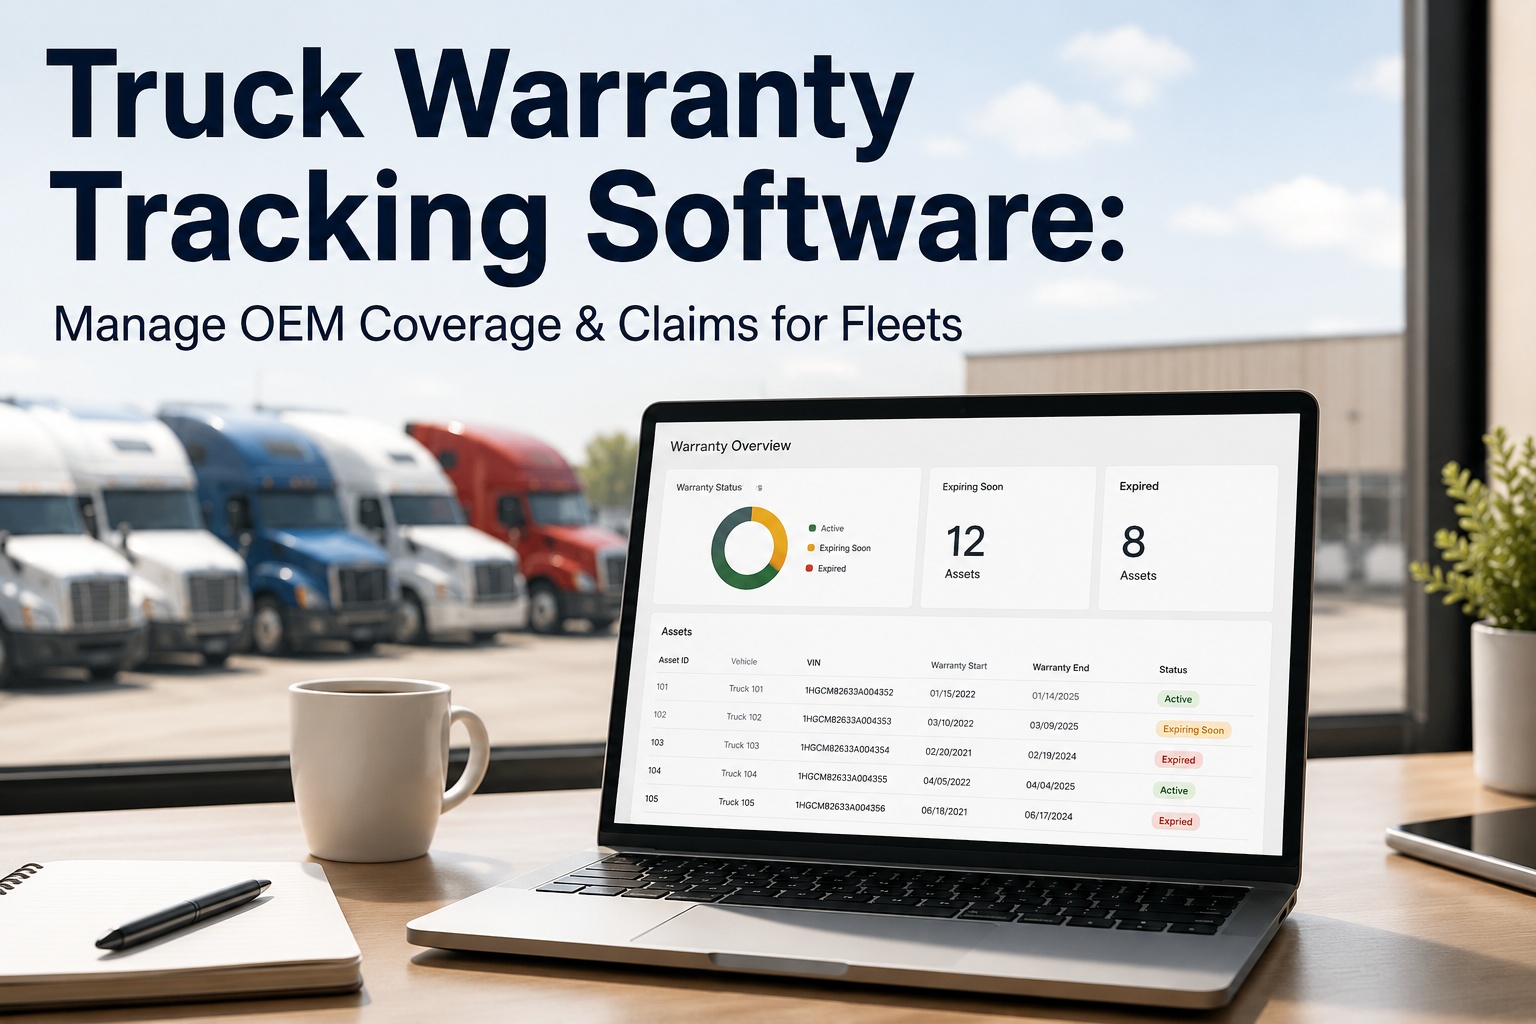
Most fleets already collect the data — every driver files a DVIR, every mechanic closes a work order, every terminal knows which trucks are down. The problem is where that data sits: in a stack of paper, in one terminal's inbox, in a mechanic's head. A dispatcher three states away trying to dispatch a load still has to make a phone call to find out if the truck is even roadworthy. A fleet vehicle condition dashboard turns those scattered DVIRs into a single live view — every truck, every yard, every open defect visible on one screen. Start free and see your whole fleet's condition on one screen.
Fleet Condition · DVIR → Dashboard · Live Visibility
Turn Your DVIR Data Into a Live Fleet Condition View
Every driver's inspection, every open defect, every truck ready to dispatch — rolled up from every terminal into one dashboard your operations team actually watches. Truck Inspection & Maintenance Management Software runs the loop: DVIR in, defects graded, status live, so dispatch stops calling around to ask if a truck is roadworthy.
Liveevery DVIR reflected in the dashboard on submit
Rolled upevery terminal, one view for HQ
Actionableevery defect graded & routed to a work order
The Visibility Problem — Data You Have vs. Data You See
The gap between what a fleet knows and what its dispatch team can see is where most preventable downtime lives. A DVIR filed on paper at 6 a.m. often doesn't reach the maintenance planner until end of shift, and doesn't reach HQ at all. This is why a truck can be sitting with a known defect while dispatch assigns it a load — the information exists, it just hasn't made the trip from the yard to the screen.
📋Without a dashboard
- DVIRs pile up on clipboards or in scanned PDFs no one opens
- Dispatch calls the yard to ask if a truck is safe to load
- Terminal managers each keep their own spreadsheet
- HQ finds out about an OOS truck when the load is late
- Repeat defects on the same asset never get correlated
📊With a live condition dashboard
- Every submitted DVIR updates the fleet view instantly
- Dispatch sees a green/amber/red status before assigning
- HQ sees every terminal side-by-side, no phone calls
- Every open defect linked to its work order and mechanic
- Repeat-defect patterns surface as a flag on the asset
What a Condition Dashboard Actually Shows
A condition dashboard isn't a status page — it's the operational cockpit for the fleet. Six tiles, refreshed live, showing the questions dispatch and maintenance ask every day: how many trucks are ready, how many are down, what's blocking the ones in the middle, and where the trend is going.
Fleet Condition Dashboard · Live
Ready to Dispatch
142
DVIR passed, no open defects
Defect — Scheduled
27
Non-OOS defect, PM queued
Out of Service
6
Safety-critical, dispatch blocked
In Shop
11
Work order in progress
Awaiting DVIR
4
Pre-trip not yet filed today
Repeat-Defect Watch
3
Same defect ≥3× in 30 days
Every Truck, a Traffic-Light Status
Behind every tile is a per-truck status the dispatcher can click into. The traffic-light model is the language everyone in the yard already speaks — green, amber, red — and it means the same thing at every terminal. No dispatcher has to remember whether a specific defect is OOS or not; the software already graded it.
GREEN
Ready
Pre-trip filed, no open defects, current on PM. Dispatch may assign any load.
AMBER
Defect — schedulable
Minor defect logged (e.g., marker bulb, oil weep) — dispatch OK, repair queued.
RED
Out of service
Safety-critical defect (fuel drip, brake OOS, bald steer) — dispatch blocked.
BLUE
In shop
Work order open — mechanic assigned, expected completion visible.
Why the grade decides, not the dispatcher On paper DVIRs, dispatchers routinely make judgment calls on whether a "small leak" or "light out" means the truck rolls. That judgment call is exactly what CSA violations and OOS orders are made of. In our software, the FMCSA thresholds are the rule — a defect is auto-classified OOS or schedulable the moment it's logged, and dispatch sees the color, not the debate.
The Terminal Roll-Up
A single-terminal fleet can survive on radio chatter — everyone can see the yard. A multi-terminal fleet cannot. The condition dashboard's roll-up view puts every terminal side by side, so a director in HQ can see at a glance which yards are healthy and which are running an outsized number of open defects or overdue inspections.
| Terminal | Assets | Ready | Defect | OOS | Comp. |
| Dallas South |
64 |
52 |
8 |
1 |
97% |
| Phoenix West |
48 |
39 |
6 |
2 |
96% |
| Chicago North |
51 |
38 |
9 |
3 |
88% |
| Atlanta East |
27 |
13 |
4 |
0 |
74% |
What the roll-up reveals Atlanta East isn't running a maintenance problem — it's running an inspection-compliance problem. Ten trucks in that terminal haven't filed today's DVIR, which is why the "Ready" count is low. A director looking at this view fixes it with one phone call, not five. This is what turns a dashboard from a wall-decoration into a decision tool.
The Data Feed — How DVIRs Become Dashboard Tiles
The dashboard isn't a separate system — it's the same data the driver, mechanic, and dispatcher are already producing, plumbed into one view. Nothing new to enter, no duplicate data, no extra keystroke.
1Driver files DVIRGuided pre-trip on mobile — passed or defect flagged
→
2Defect auto-gradedSoftware tags it OOS or schedulable per FMCSA thresholds
→
3Work order createdRouted to the assigned terminal's shop queue
→
4Dashboard updatesTruck's tile turns amber/red — live for dispatch & HQ
The Dashboard Is the Product
Truck Inspection & Maintenance Management Software isn't a separate reporting tool — the dashboard is the natural output of the work drivers and mechanics are already doing. The mobile DVIR feeds it, the work order updates it, the mechanic's sign-off clears it. HQ gets live visibility without a single spreadsheet, and every terminal keeps working the way it always has — the difference is HQ can now see it.
The Five Questions a Condition Dashboard Should Answer
A dashboard earns its keep only if operations actually use it. The test is whether five ordinary questions a fleet asks every day get answered from one screen instead of a chain of phone calls.
Q1How many trucks can I dispatch right now?The green tile. One number. No follow-up call to the yard.
Q2Which trucks are grounded and why?Click the red tile — see the truck, the defect, the mechanic, the expected fix time.
Q3Which terminal is behind on inspections?Roll-up view — compliance % by yard, ranked.
Q4Which trucks keep breaking the same way?Repeat-defect watch — same defect ≥3× in 30 days flags automatically.
Q5Are we audit-ready this quarter?DVIR retention, eDVIR signatures, work-order closure trail — all exportable.
Frequently Asked Questions
What's the difference between a fleet management dashboard and a fleet condition dashboard?
A general fleet management dashboard focuses on where trucks are and what loads they're carrying — GPS, dispatch status, driver hours. A fleet condition dashboard focuses on whether the truck is safe and legal to operate — DVIR status, open defects, OOS conditions, PM compliance. Both matter, but they answer different questions. A dispatcher looking at a location dashboard sees the truck is in the yard; a dispatcher looking at a condition dashboard sees the truck is in the yard
and failed its pre-trip. Our software gives you the second view, so no truck gets assigned a load it isn't safe to run.
Start free and add a condition layer to your fleet
Does this replace our existing telematics or GPS?
No — it complements them. Telematics tell you where the truck is and how it's being driven; the condition dashboard tells you whether it should be moving at all. Most fleets keep their existing GPS provider and layer the condition view on top, using the DVIR and work-order data our software already collects. The two answer different sides of the same question and are strongest side by side.
Contact us to see how it fits your current stack
How current is "live"?
Every submitted DVIR and every closed work order updates the dashboard on submit — not on a nightly batch, not on a report you refresh. When a driver flags a defect at 7 a.m., dispatch sees the truck's tile change to amber or red before the driver walks back to the office. When a mechanic closes the repair at 3 p.m., the tile goes back to green. That's what makes the dashboard useful to dispatch instead of decorative for management.
Start free and watch a truck's status change live
Can HQ see every terminal without extra work for the terminals?
Yes — that's the point of the roll-up view. Each terminal continues to run its own inspections, its own work orders, its own shop queue. The software rolls those numbers up into one HQ view automatically. Terminal managers don't file extra reports; HQ doesn't ask for them. The visibility is a side effect of the work already being done, which is why it actually gets used instead of becoming another "we should update that dashboard" chore.
Contact us to walk through the roll-up on your terminals
DVIR In · Grade Applied · Dashboard Live
Give Your Operations Team a Live View They'll Actually Use
Truck Inspection & Maintenance Management Software turns the DVIRs your drivers already file into a live fleet condition dashboard — green, amber, red at a glance, every terminal rolled up for HQ, every defect linked to its work order and mechanic. No new data entry, no extra step for the yard, just visibility where there was a phone call before.
No credit card required. Free for up to 3 trucks. Built for FMCSA-compliant fleets.