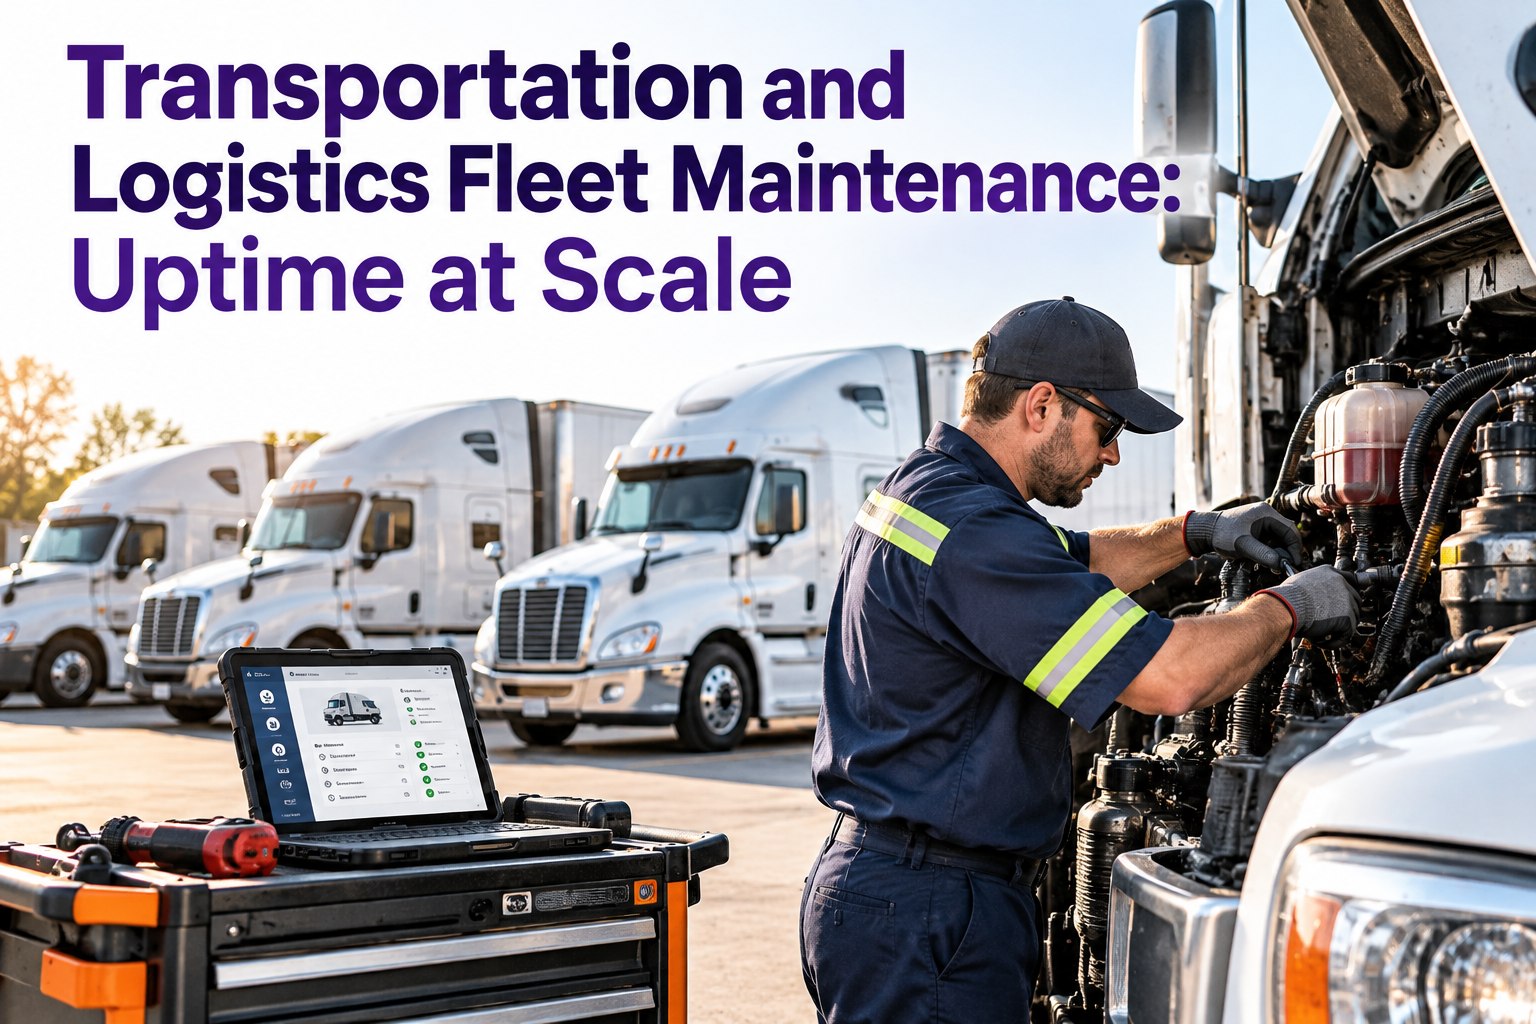
In transportation and logistics, the truck only earns while it's moving. A parked unit runs the meter backward — the driver still gets paid, the load shifts to other trucks, and the delivery commitment slips. Benchmarks put unplanned downtime at $448–$760 per truck per day, and with driver, towing, and lost load revenue the real number climbs past a thousand. The hard part: a 15-truck fleet has 60-plus service intervals on different mileage, hour, and calendar clocks, and missing one is where the breakdown comes from. This page is about running maintenance as an uptime engine at scale, and how Truck Inspection & Maintenance Management Software (TIM) keeps every unit earning. Start free and build your uptime program in minutes.
Uptime Isn't a Maintenance Metric. It's the Whole Business Model.
You want trucks earning revenue, contracts kept, and breakdowns turned into planned service events instead of roadside emergencies. That's a workflow problem at scale: PM triggers that fire on miles and hours, DVIRs that catch defects before dispatch, and a shop loop that closes fast. TIM runs it — and every defect logged gets a first response within 4 hours, acknowledged, graded, and assigned, so a fault never sits long enough to strand a load.
The Economics of a Parked Truck — Where the Money Actually Goes
Most managers think of downtime as a repair bill. The repair is the small half. When a truck sits, you're losing revenue, paying a driver who can't work, risking a delivery contract, and accelerating wear on the other trucks forced to cover the load. Using ATRI's ~$2.26-per-mile average across a 450-mile day, a single truck represents roughly $1,000 of daily operating economics before the repair itself — and the invisible costs routinely exceed the visible ones.
- Parts & labor
- Towing / roadside
- Emergency-repair premium (3–9× scheduled)
- Lost load revenue (~$1,000/day economics)
- Idle driver pay
- Rebalancing loads onto other units
- Missed commitments & contract risk
Reactive vs. Preventive — The Same Fleet, Two Different Businesses
The gap between a disciplined PM program and a reactive one isn't a rounding error — it's the difference between a fleet that makes money and one that barely survives. Disciplined fleets run 12–18¢ per mile in total maintenance; reactive fleets hit 25–35¢ once you fold in emergency premiums, towing, downtime, and missed revenue. On a truck running 120,000 miles a year, that's $8,400–$20,400 in difference — per truck.
- Lives on emergency fixes & surprise parts orders
- Breakdowns strand trucks on the highway
- Costly, unplanned downtime
- Repairs cost 3–9× scheduled maintenance
- Erodes contract trust with missed windows
- Breakdowns converted to planned service events
- Downtime is controlled, not discovered
- Protects uptime, compliance, and asset value
- Prevents the 3–9× emergency premium
- Reliable delivery keeps contracts intact
The Four Levers of Uptime at Scale
Engineering downtime out of a fleet comes down to four levers, and each one only holds up if it's systematized across every truck — not left to memory. This is the core loop of a transportation maintenance program, and where a platform earns its keep.
Tie every interval to miles or engine hours — not just calendar dates — so it fires automatically on the trigger that gets measured. A 15-truck fleet has 60+ intervals; no one tracks that by hand.
Driver pre-/post-trip inspections catch a defect before dispatch, when it's a work order — not on the shoulder, when it's a breakdown. The daily check is the fleet's earliest warning.
A defect has to flow — flagged, graded, assigned, repaired, closed — without stalling in someone's inbox. Speed of the loop is what converts a fault into controlled, planned downtime.
Declining MTBF on one unit or rising repair times flag a problem weeks before it strands a truck. Predictive metrics let top fleets cut unexpected failures dramatically.
Sixty Intervals Per Fifteen Trucks. That's Not a Binder Job.
TIM runs all four levers as one system: mileage-, hour-, and calendar-based PM triggers per unit; digital DVIRs that route a defect straight to the shop; work-order management that moves a fault from flagged to closed; and the KPI trends that catch a failing unit early. Whether you run 10 trucks or 500, the loop is the same — and it runs without anyone holding it in their head.
The KPIs That Prove Uptime — and Set Your Target
You can't improve what you don't measure. These are the metrics that move the needle, with the targets top transportation fleets hold. The right uptime target depends on your operation: long-haul runs tighter than regional because highway miles are more predictable than stop-start delivery.
Share of scheduled days a truck runs without downtime. Below 95% signals a chronic problem to investigate.
OTR fleets hold the highest uptime — downtime measured in hours per month, not days.
Regional delivery runs slightly lower; more stops and mixed duty mean more service exposure.
Rising MTBF = more reliable equipment. A declining trend on one unit is an early warning.
How fast the shop loop closes. Shorter MTTR turns unplanned events into brief, controlled ones.
Share of scheduled PMs done on time. High completion is what prevents the 3–9× emergency repair.
Frequently Asked Questions
Keep the Trucks Earning — That's the Only Job
PM triggers on miles and hours, DVIRs that catch defects before dispatch, a shop loop that closes fast, and the KPIs that prove it — all in one system that scales from 10 trucks to 500. Turn breakdowns into planned events and keep every unit on the road.