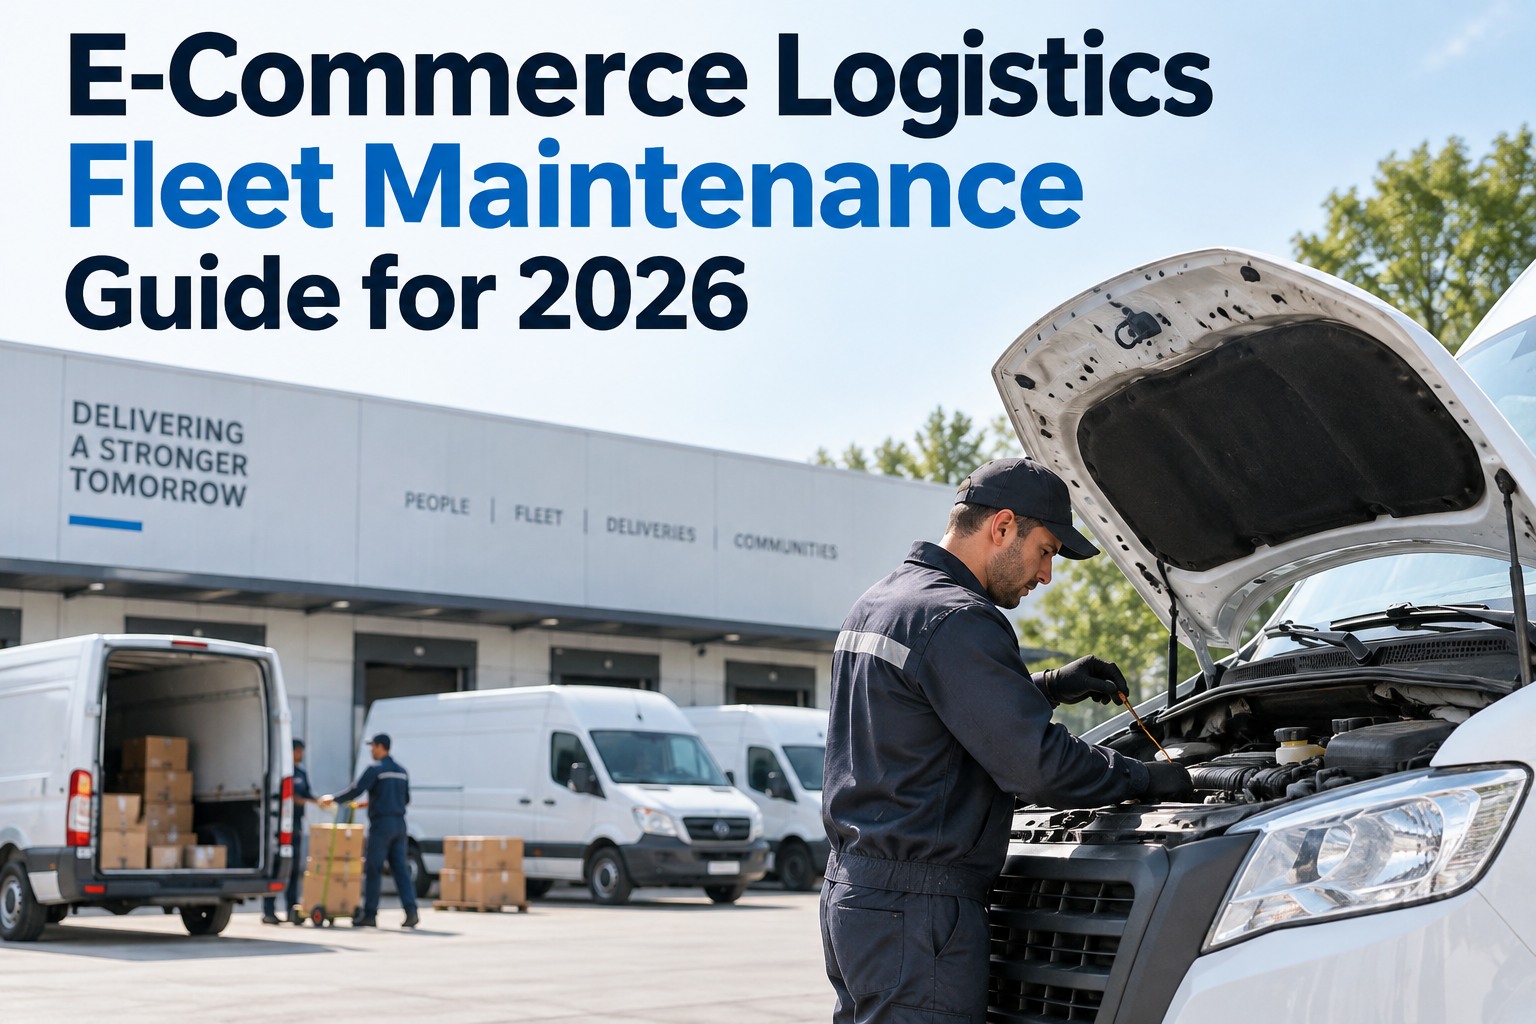
A standard PM schedule was built for a predictable truck: steady miles, gentle brake use, an oil change every so many thousand miles. An e-commerce delivery vehicle breaks every one of those assumptions. It runs 60 to 120 stops a route, idles constantly, loads and unloads all day, and then volume doubles for six weeks at peak — and a mileage-based interval designed for a 30-stop route will quietly under-service it the whole time. The result shows up as a brake failure at 9,000 miles instead of 25,000, a van stranded mid-route in a delivery window, and a missed SLA that threatens the contract. This guide covers the 2026 maintenance program built for how e-commerce fleets actually run: why calendar PM breaks, the usage-based model that replaces it, and the peak-season playbook that keeps trucks moving when it matters most.Start a free trial and match your PM schedule to your dispatch schedule.
The E-Commerce Logistics Fleet Maintenance Guide
Volume peaks break traditional PM cadence — and one missed service becomes a stranded van in a delivery window. Our truck inspection & maintenance management software rebuilds your PM around real usage, so every vehicle is serviced at the right time, work lands on low-volume days, and your fleet stays above 95% PM compliance through peak. See it on your own fleet in minutes — hit Start Free Trial below, or talk to our team.
Why the Same Van Wears Twice as Fast
The difference between an e-commerce route and a standard one isn't the miles — it's the intensity. A downtown route might cover 45 miles but rack up 120 stops and 600 brake events; a suburban route covers 180 miles with 40 stops and 150 brake events. Same calendar interval, completely different wear. Every stop is a brake application, a door cycle, and an idle event, and that's what actually consumes the vehicle.
Why Calendar-Based PM Breaks at Peak
Calendar and mileage intervals assume every vehicle ages at the same rate. That falls apart the moment runtime hours double during peak weeks — the fixed schedule under-services the hard-working vans and over-services the light ones, all at once.Start free and set usage-based triggers so peak volume doesn't outrun your PM.
A 12,000-mile brake interval leaves an 80-stop urban van under-serviced for thousands of miles while pad-failure risk climbs.
Peak doubles engine hours and brake events, but the calendar date doesn't move — so the schedule silently drifts out of sync with reality.
A van idling at every stop banks engine hours far faster than its miles suggest, so mileage-only fluid checks arrive late.
The biggest PM failure isn't the schedule — it's the week when something always feels more urgent than the service that's due.
The Fix: Usage-Based PM Triggers
The answer isn't checking more often across the board — it's triggering service by how each vehicle is actually used. Route-based PM fires on real usage metrics, so a 120-stop van gets brake service roughly 3× as often as a 40-stop van, because that's what the wear profile demands.Contact our team to configure usage-based triggers for your fleet.
Match the Maintenance Schedule to the Dispatch Schedule
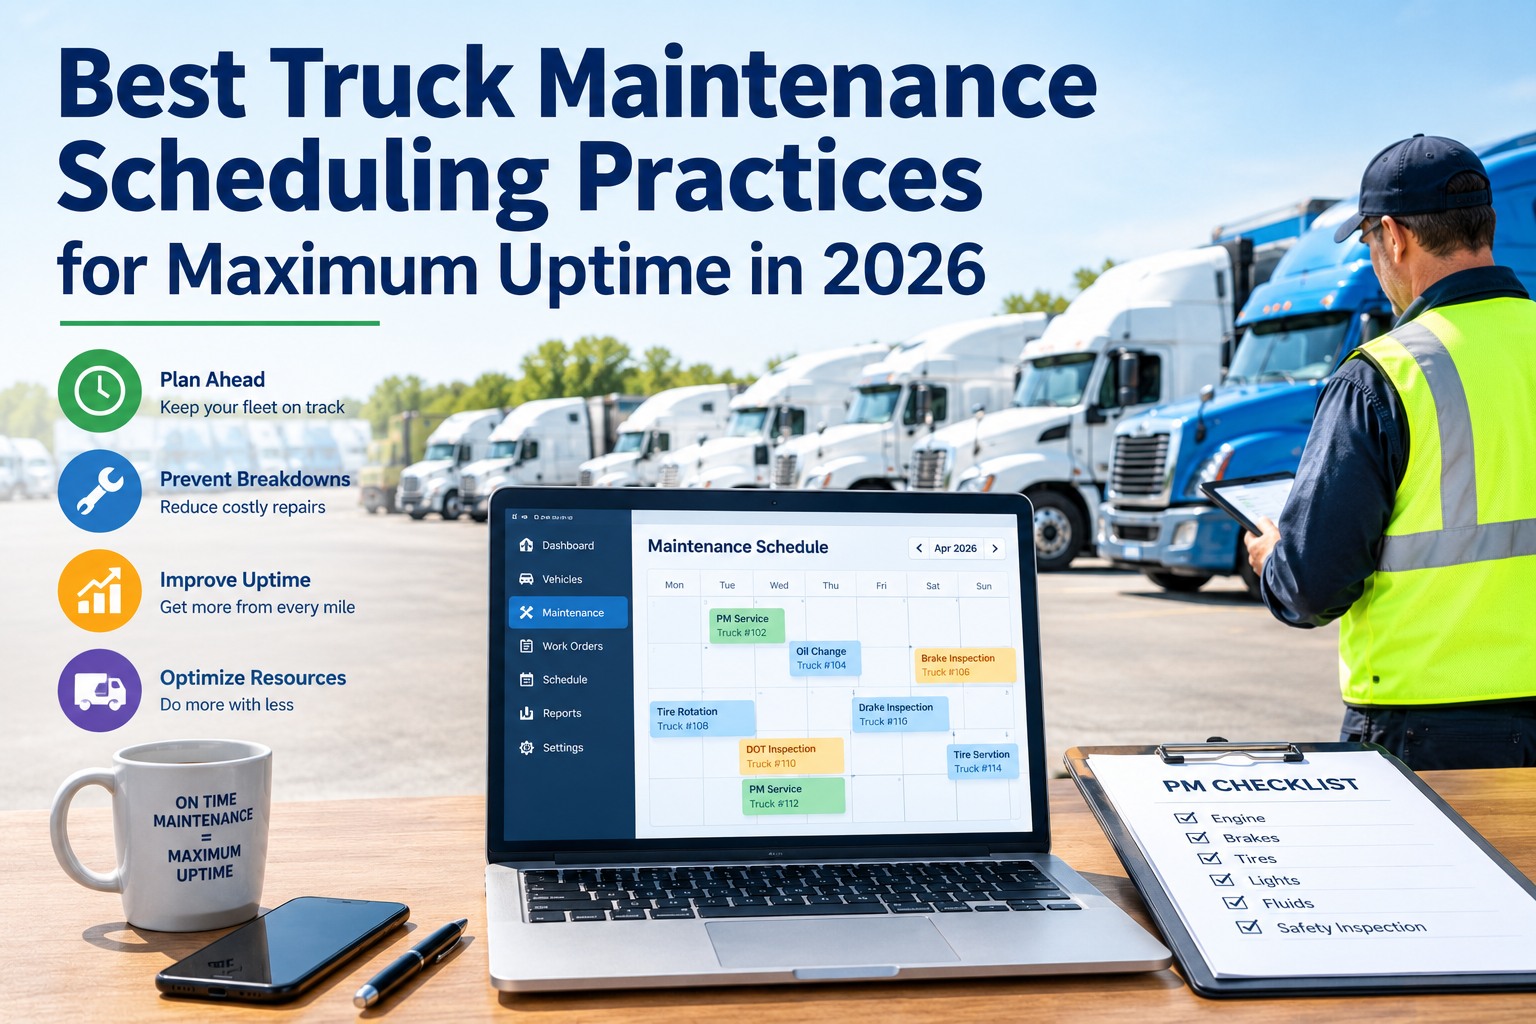
Our truck inspection and maintenance management software replaces paper DVIRs and PM spreadsheets with mobile inspections, automated work orders, and real-time compliance dashboards. Service triggers by mileage, engine hours, and route intensity; upcoming services surface 7–14 days out so work lands on low-volume days; and a live dashboard shows every van green, yellow, or red — helping fleets lift PM compliance above 95% and stay DOT-ready year-round.
The Pre-Peak Playbook
Peak-season uptime is won before volume spikes, not during. Four moves, made while freight is still slow, prevent the majority of peak breakdowns.Start free and build your pre-peak checklist into the platform.
Complete brake, tire, cooling, and fuel work while shop capacity and parts are still easy to get. Prioritize high-use, high-revenue vehicles first.
Brake pads, filters, belts, and cooling components fail most under sustained load. Build a parts list from the peak schedule and add 15–20% for the unplanned failures that happen every year.
As routes lengthen and runtime climbs, track vehicle health live so a developing problem gets caught while it's cheap — not when a driver calls from the shoulder.
Analyze which components failed under load and feed it back into next season's pre-peak checklist and parts stock.
The Cost Math That Makes the Case
Preventive maintenance is the most direct cost-control lever an e-commerce fleet has in 2026 — and the gap between disciplined and reactive fleets is stark.Contact support to see the ROI modeled on your fleet size.
Frequently Asked Questions
Keep Every Van on Route Through Peak
Our truck inspection and maintenance management software gives e-commerce fleets one mobile-first platform for DVIRs, usage-based PM scheduling, automated work orders, and real-time compliance dashboards — service triggered by stop count and engine hours, work staged for low-volume days, and every truck audit-ready all year. Leading fleets use it to cut breakdowns, pass DOT audits, and give drivers a maintenance system they'll actually use.