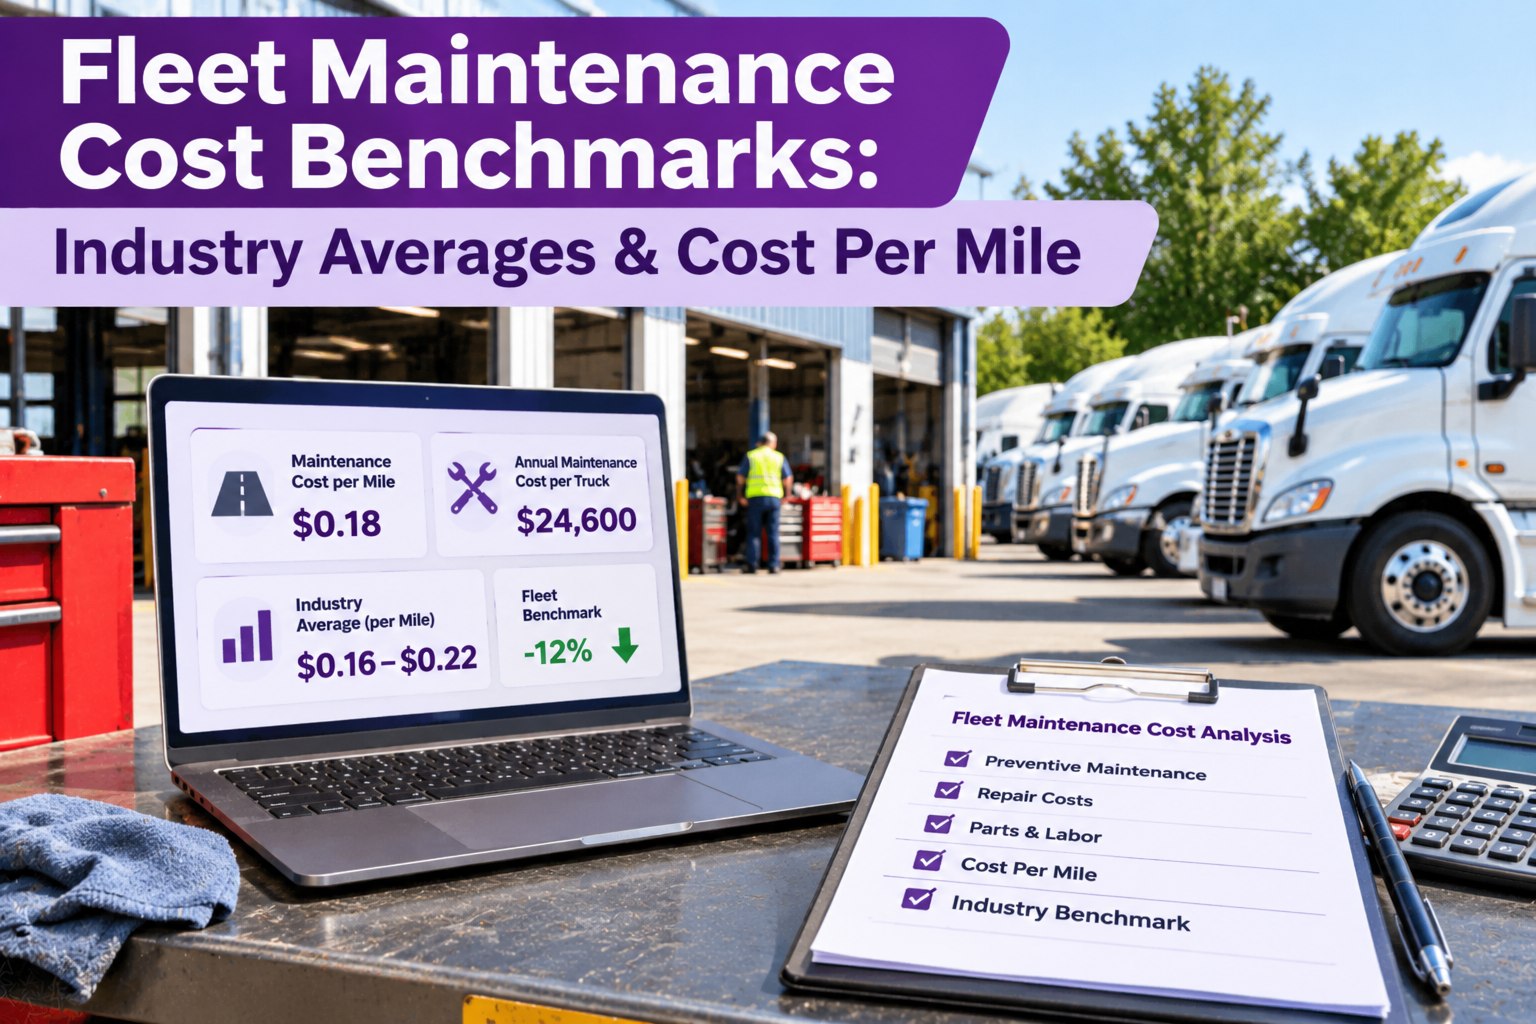
Without a benchmark, a big maintenance bill just looks normal right up until a CFO asks why a competitor runs at half your cost per mile. The number to know: the industry average for repair and maintenance is about 21.5 cents per mile, yet the best-run fleets do it for closer to 12. The gap between them isn't luck or fleet size — it's a few things you can measure and move. This guide lays out the 2025 benchmarks, what drives cost per mile up, and where the controllable money actually sits. Start free and see your own cost per mile.
Fleet Maintenance Cost Benchmarks: Industry Averages & Cost Per Mile
The 2025 Benchmark, in Three Numbers
The American Transportation Research Institute's annual cost study is the industry's yardstick, and its 2025 figures set the baseline every fleet should measure against.
Why Cost Per Mile Beats Your Total Bill
A truck that costs $50,000 a year to maintain sounds alarming — until you divide it by the miles it ran. Cost per mile is the only figure that lets you compare a long-haul sleeper against a regional day cab, this year against last, your fleet against the benchmark. Three inputs produce it, and most fleets track only the first.
The Quartile Gap Is Where the Money Hides
The average is only the middle of a very wide range. Top-quartile fleets run maintenance at 12 to 18 cents a mile; bottom-quartile fleets clear 30 cents and up. That spread looks small per mile and enormous per year.
The point of benchmarking isn't to feel good about an average; it's to find which side of that gap your fleet is on and what's putting it there. Book a demo to see where your fleet sits against the benchmark.
Age Is the Biggest Driver — So Benchmark by Bracket
The single largest force on cost per mile isn't parts prices or labor rates — it's how old the trucks are. Maintenance cost climbs steeply with age, and averaging a mixed-age fleet into one number hides the trucks quietly draining the budget. Benchmark by age bracket, not a single fleet average.
The One Ratio That Predicts Your Budget
If you track only one thing beyond cost per mile, track the split between planned work and reactive breakdowns. It's the lever that moves everything else — because the same job costs far more as an emergency than as a scheduled service.
The math compounds fast: every 10% of work you move from reactive to planned cuts total maintenance cost by an estimated 15 to 20%. That's the mechanism behind the whole quartile gap — not cheaper parts, but fewer surprises. Start free and watch your planned-to-reactive ratio move.
A Fleet Is a P&L on Wheels
Every truck either earns or bleeds, and cost per mile is how you tell which. Capture the cost at every work order, split planned from reactive, and the benchmark stops being someone else's report and becomes your own dashboard.
Benchmark Like for Like
One caution before you compare: cost per mile only means something against a similar operation. A vocational truck on stop-start, high-idle work will always read higher than a highway sleeper, and a day cab higher still per mile than a long-hauler spreading cost over big miles. When you benchmark, normalize for truck type, duty cycle and age — then the gap you find is real signal, not just a difference in the work. The industry average is a starting line, not a target; your target is the top quartile of fleets that run the way yours does. Book a demo to benchmark against fleets like yours.
Why Fleets Benchmark Cost in Software
Frequently Asked Questions
ATRI's 2025 benchmark puts repair and maintenance at about 21.5 cents per mile for a Class 8 truck — roughly 9% of the total cost of operation. Top-quartile fleets run 12 to 18 cents; bottom-quartile fleets exceed 30. The spread, not the average, is the useful part. Book a demo to see your fleet's number.
Most often it's two things: an aging fleet, since trucks over 10 years cost several times more per mile than newer ones, and a high reactive-repair share, since an emergency job runs 3 to 9 times a planned one. Benchmark by age bracket to see which is driving it. Book a demo to break your CPM down by cause.
Shift work from reactive to planned — every 10% moved cuts total maintenance cost an estimated 15 to 20% — and manage the age curve so no single old truck distorts the fleet. Both start with capturing cost per vehicle and watching the planned-to-reactive ratio. Book a demo to see the levers on your own data.
Normalize first. Vocational and stop-start trucks read higher per mile than highway sleepers, so compare like with like — same type, duty and age bracket — before judging the number. The right target is the top quartile of fleets operating the way yours does, not a blanket average. Book a demo to benchmark by truck type.
Stop Guessing What Your Trucks Cost to Run
Truck Inspection & Maintenance Management Software captures cost at every work order, calculates cost per mile per vehicle, and shows your planned-to-reactive ratio — so you benchmark against the industry with your own numbers, not estimates.