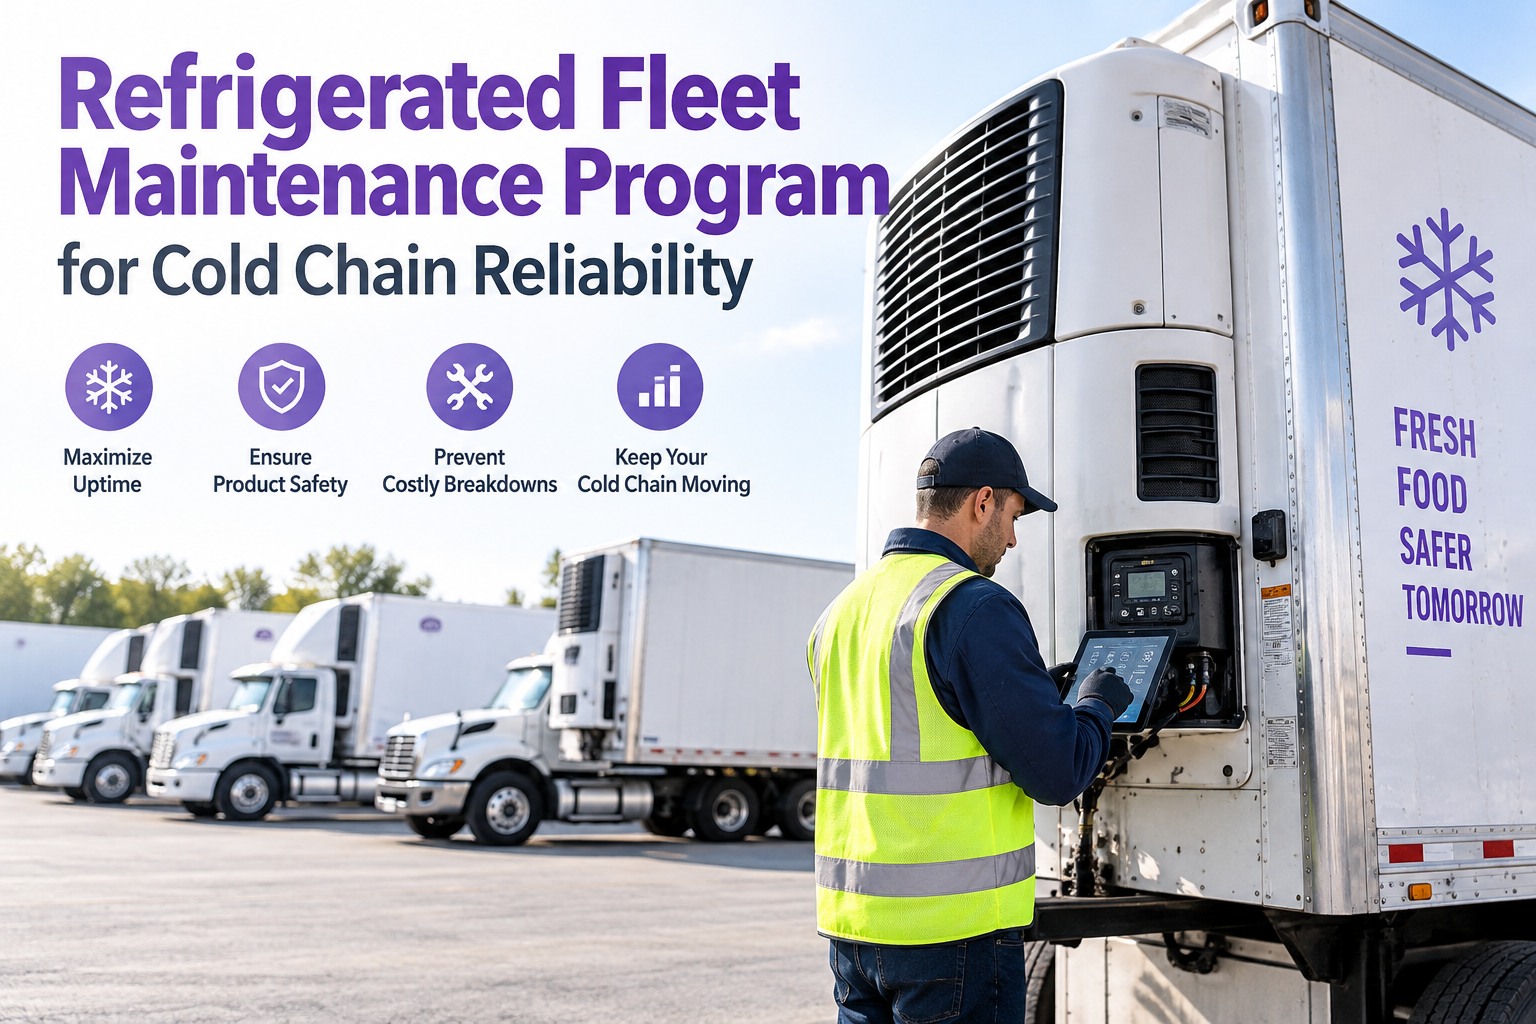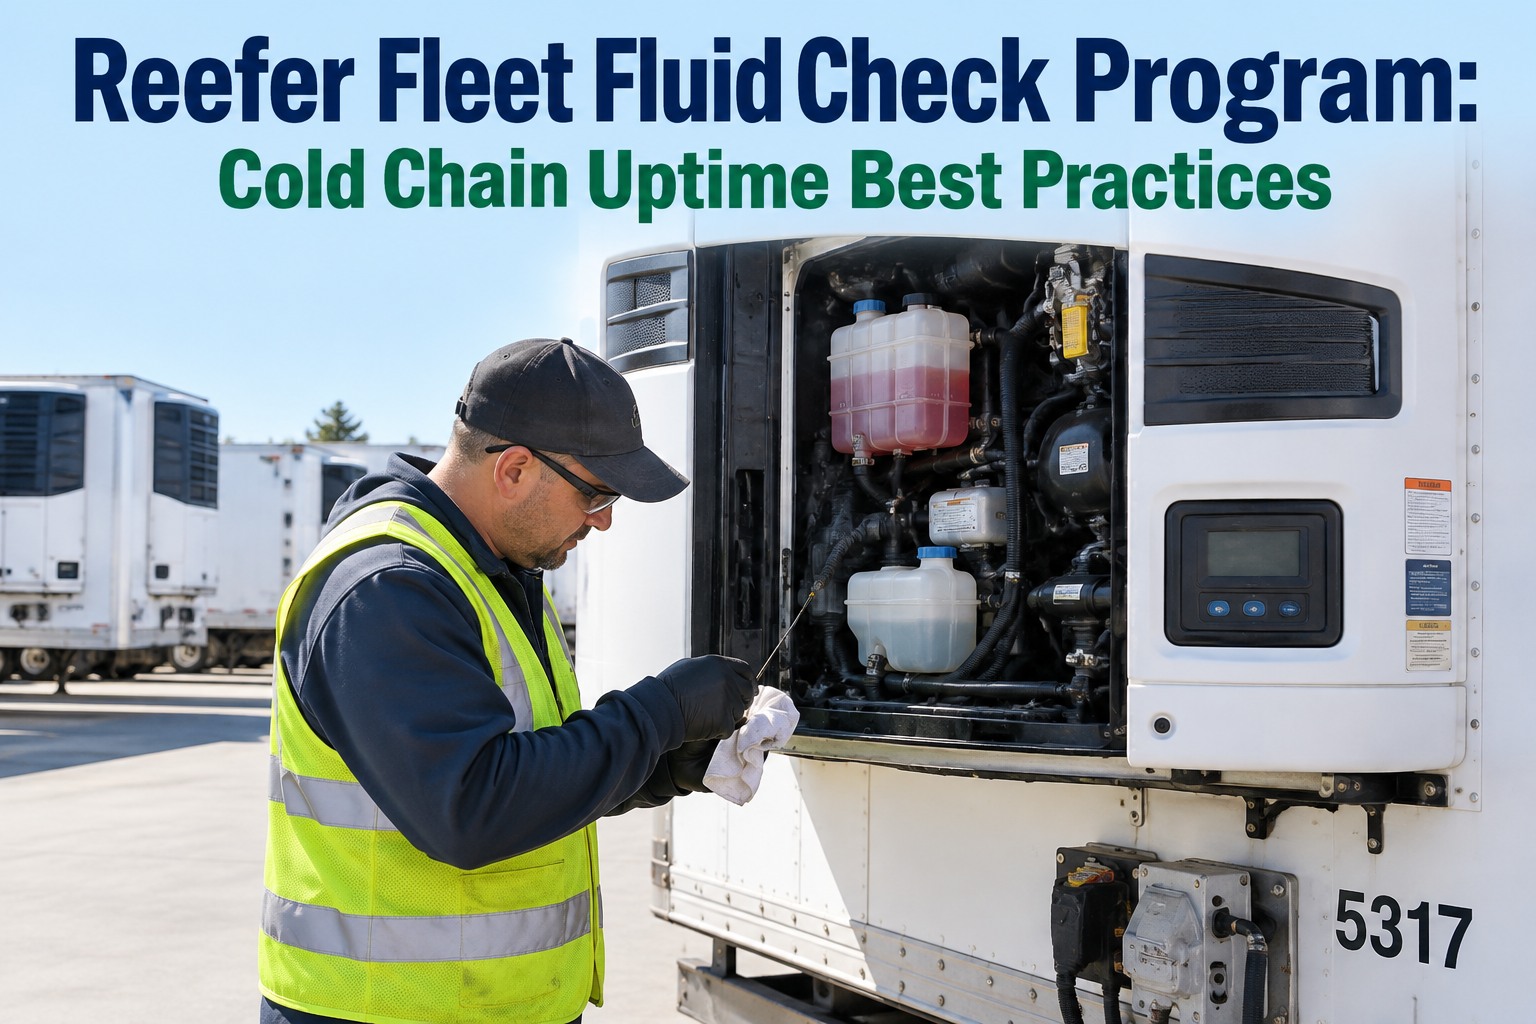
A reefer breakdown isn't like a dry van breakdown. When a dry van goes down, you delay the load. When a reefer goes down, you can lose the entire load — a $45K trailer of frozen protein or $28K of pharmaceutical vaccines rejected at the receiver's dock because the pulp temp went out of spec. The math shifts everything: reefer PM isn't a maintenance cost line, it's a load-loss prevention line. This guide breaks down the reefer subsystems that fail, the PM cadence that keeps uptime above 99%, the pre-trip that catches problems before dispatch, and the KPIs that surface drift before the first rejected load. Truck Inspection & Maintenance runs reefer PM overlays on driver phones with temperature-log evidence attached to every trip — sign up free or contact our team.
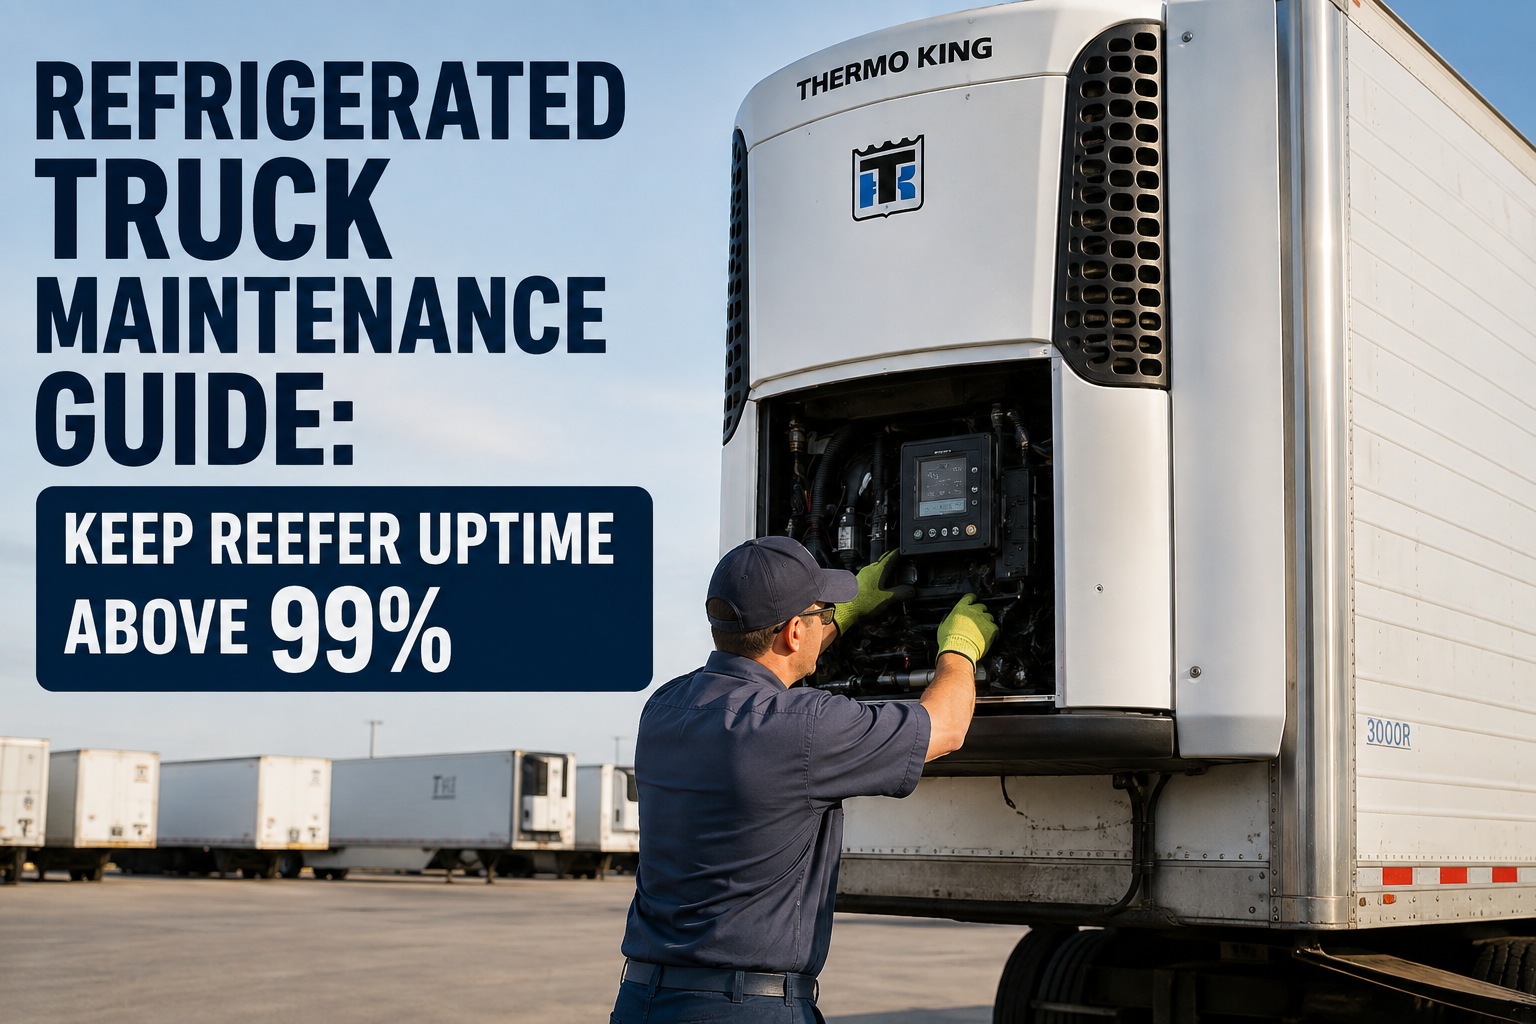
Refrigerated Truck Maintenance — Keep Reefer Uptime Above 99%
Every 1% of reefer downtime = one rejected load per 100 trips. The math is unforgiving.
Why Reefer PM Is a Load-Loss Prevention Program
Reefer economics don't behave like dry van economics. Three numbers reframe the conversation:
A single load rejected at receiver dock for out-of-spec pulp temp: $18K-$45K frozen protein, $8K-$22K produce, $28K-$85K pharma. Plus disposal cost, plus customer credit, plus lane damage.
Top-quartile reefer fleets hold 99%+ uptime. Every 1% below target translates roughly to 1 rejected load per 100 trips — before any maintenance repair cost even enters the calculation.
Roughly 72% of reefer failures show warning signs 3-14 days before hard fail — pull-down time drift, belt squeal, defrost cycle running long, evap coil frost pattern. All catchable at PM.
Every 1% below 99% uptime = 1 rejected load per 100 trips. Start a free account and put reefer PM overlays on driver phones today.
The 6 Reefer Subsystems — What Fails and Why
Reefer units aren't monoliths — they're 6 distinct subsystems with 6 distinct failure modes. Each has its own PM cadence and its own warning signs:
Want a printable 6-subsystem reefer PM reference for the shop wall? Contact our team and we'll send one, free.
The Reefer PM Cadence — 4 Tiers
A working reefer PM program has 4 tiers running in parallel. Each tier catches a different failure mode:
Setpoint programmed correctly, unit runs 15 min at pre-cool, no error codes stored, fuel level, defrost cycle observed, door seal walk-around, temperature recorder armed. Catches 60% of pre-departure failures.
Battery terminal clean/tight, alternator output test, sensor calibration verify, error code log review, door gasket inspection with paper-slip test, drain check, insulation walk-around. Catches control drift + seal failures.
Evap coil wash with approved coil cleaner, condenser fin power-wash from engine side, fan blade balance check, belt tension + condition, defrost heater ohm test. Catches airflow degradation before summer.
Refrigerant recovery + evacuate + recharge to OEM weight, receiver-drier replaced, expansion valve verified, engine oil + all filters + coolant service (if applicable), full engine hour tracking reset.
Auto-fire the right PM tier on both calendar AND engine-hour triggers — sign up free and configure all 4 tiers in under 20 minutes.
The One Metric That Predicts Reefer Failure 3-14 Days Out — Pull-Down Time Trending
The clearest early-warning signal a reefer will fail is pull-down time drift — how long the unit takes to bring cabin temp from ambient down to setpoint at start of trip. A clean, healthy reefer with correct refrigerant charge and clean coils hits setpoint in a predictable window. When pull-down time starts climbing week-over-week — even by a few minutes — the unit is losing capacity. That drift shows up 3-14 days before hard failure at receiver dock, always. Track pull-down time per unit per trip, plot the 4-week rolling average, and flag any unit trending 10%+ longer than baseline. Fleets that add pull-down trending catch 60-70% of would-be roadside/receiver-dock failures during scheduled maintenance windows instead. Start a free account and add pull-down trending to every reefer PM today.
The Reefer Pre-Trip — 7 Items Every Driver, Every Trip
The driver pre-trip is the single highest-leverage safeguard against a rejected load. 7 items, under 5 minutes, catches most pre-departure failures:
Setpoint Programmed & Confirmed
Verify setpoint matches load spec (frozen -10°F to 0°F, chilled 34-38°F, produce spec varies). Confirm continuous vs cycle-sentry mode. Confirm defrost interval set for product.
15-Minute Pre-Cool Before Loading
Run unit at setpoint 15 min minimum before loading to remove residual heat from box. Never load into a hot trailer — every degree above setpoint at load time is an hour of catch-up in transit.
No Stored Error Codes
Check microprocessor error log — should be empty or all cleared/acknowledged. Any un-cleared active alarm at pre-trip = truck stays until diagnosed. Photograph the display.
Fuel Level (Diesel Units)
Full or minimum 75% for standard trip. Reefer diesel is a separate tank from tractor. Running out mid-trip is a rejected-load event.
Defrost Cycle Observed
Manually trigger a defrost cycle at pre-cool. Verify heaters engage, verify termination temp reached, verify unit returns to cool mode. 30-second check that catches defrost failures early.
Door Seal Walk-Around
Close doors, walk around trailer with flashlight looking for gaps at gaskets. Any visible gap = seal problem. Paper-slip test — should hold at any point.
Temperature Recorder Armed
Confirm continuous temp logger (Sensitech, TempTale, or built-in) started, ID matches load, sensor placement verified. This is the receiver's evidence of cold-chain integrity.
Need help sequencing the 7-item pre-trip against your drivers' existing dispatch workflow? Get in touch for a free 15-minute review.
Every reefer trip starts with a photo-verified 7-item pre-trip, ends with a signed temp log on file.
Driver pre-trip on phone with photo evidence, pull-down time tracked per unit per trip with 4-week trending, defect auto-fires WO before dispatch. Free forever for up to 3 vehicles — create your free account or talk to our team.
KPI Dashboard — 6 Reefer Uptime Metrics
Six numbers that surface reefer program health week-over-week. Watch these and rejected loads get rare:
Hours reefer available to dispatch ÷ total hours in fleet. Below 99% = 1+ rejected loads per 100 trips baked in.
Loads refused at receiver dock for out-of-spec pulp temp. Every rejection = $18K-$85K exposure + customer damage.
4-week rolling avg pull-down time vs baseline per unit. Above 10% drift = capacity loss trending toward failure.
Every dispatched reefer has photo-verified 7-item pre-trip on file. Below 100% = defensibility gap on rejected load.
Continuous temp log attached to every trip record. Missing log = receiver disputes are automatic losses.
Stored error code detected at pre-trip → shop WO opened. Above 24 hours = codes riding on the road.
Track all 6 reefer KPIs and hit 99%+ uptime this quarter — create your free account in 10 minutes.
The 5 Most Common Reefer Failure Patterns
Every reefer fleet has watched at least three of these five. All five are preventable with the cadence matrix above:
Loading Into a Hot Trailer
Pattern: Driver arrives at shipper, backs to dock, doors open immediately. No pre-cool. Product loaded into 85°F trailer, unit fighting from mile 1. Pulp temp at receiver reads +3°F over spec = rejection.
Ignoring Pull-Down Time Drift
Pattern: Unit taking 40 min to hit setpoint instead of 25. Driver notes it, moves on. Two weeks later, unit can't hold setpoint under load on a hot day. Load rejection. Refrigerant charge was low the whole time.
Skipping Quarterly Coil Wash
Pattern: Evap coil accumulates food residue and biological film. Airflow drops 20%+ but unit still runs. First hot week of summer, unit derates in ambient — no capacity left. Coil wash is $85 preventive vs $12K+ product loss.
Door Gasket Damage Left in Service
Pattern: Gasket torn from forklift contact, driver notes it as "check at next PM." Unit runs continuously to hold setpoint, fuel consumption doubles, insulation loss compounds. Should be replaced same day, cost $80.
No Temperature Recorder Verification
Pattern: Recorder wasn't armed, or the sensor wasn't with the load, or the battery died mid-trip. Receiver claims product was out of spec, no cold-chain evidence to counter. Automatic loss on the dispute.
Frequently Asked Questions
What uptime should a reefer fleet target?
Top-quartile reefer fleets hold 99%+ uptime — measured as hours reefer available to dispatch divided by total fleet hours. Every 1% below 99% translates roughly to 1 rejected load per 100 trips before any repair cost enters the calculation. A fleet running 96% uptime is quietly bleeding 3-4 rejected loads per 100 trips, each worth $18K-$85K depending on cargo class. Uptime is the leading indicator; rejected loads are the trailing bill.
Which reefer subsystem fails most often?
Electrical and control system drift accounts for the largest share of preventable failures — corroded battery terminals, sensor calibration drift, un-cleared error codes riding on the truck, harness chafing at flex points. The good news: electrical/control issues also show the clearest early warning signs at monthly PM, so they're the most preventable subsystem. Refrigerant circuit issues are second most common but harder to catch without annual pressure testing and pull-down time trending.
What's the reefer PM cadence?
Four tiers running in parallel: daily driver pre-trip (7 items, under 5 minutes), monthly electrical + trailer box check (~200 engine hours), quarterly evap and condenser deep clean (~2000 hours), and annual refrigerant + engine service (5000+ hours). Hour-based intervals govern the engine service on self-powered units; calendar-based intervals govern the trailer-box, electrical, and coil work. Both cycles run independently — never skip a monthly PM because an annual is coming up.
Why is pull-down time the key predictive metric?
Pull-down time — how long the unit takes to bring cabin temp from ambient down to setpoint — reflects total system capacity in one number. Low refrigerant charge, dirty coils, weak fan, damaged insulation, defrost cycle issues all extend pull-down time before they cause outright failure. Fleets that track pull-down per unit per trip with a 4-week rolling average and flag any unit trending 10%+ longer than baseline catch 60-70% of would-be failures during scheduled maintenance instead of at the receiver dock.
Do reefers need a separate PM schedule from dry vans?
Yes. Reefer PM is additive on top of the trailer's regular DOT PM (brakes, lights, tires, structural). The refrigeration unit runs its own hour-based cadence tied to engine hours on self-powered units, plus its own calendar-based cadence for the trailer box, seals, and control system. Combining reefer PM with regular trailer PM in the shop schedule is fine for efficiency, but the reefer items are a separate checklist with separate sign-offs and separate parts.
How does Truck Inspection & Maintenance handle reefer fleets?
Truck Inspection & Maintenance ships with the 7-item reefer pre-trip pre-configured for driver phones, the 4-tier PM cadence auto-fires based on both calendar and engine-hour triggers, and pull-down time entry with per-unit 4-week trending flags any unit drifting 10%+ from baseline. Every temperature log uploads and attaches to the trip record automatically. Fault codes captured at pre-trip auto-fire a work order to the shop within minutes. Free forever for up to 3 vehicles. Sign up in 10 minutes or contact our team for larger fleets.
One reefer breakdown = one rejected load = $18K-$85K. The math favors prevention aggressively.
Full reefer pre-trip on driver phones with photo evidence, 4-tier PM auto-fired on calendar + engine hours, pull-down trending flags drift 3-14 days before failure. Free forever for up to 3 vehicles — no hardware, no contract, no credit card.