Fuel is 24-40% of total operating cost for most diesel fleets, and roughly 30% of MPG variance across similar trucks running similar routes is directly explained by maintenance condition — not driver behavior, not weather, not route. Under-inflated tires alone cost fleets 0.2% MPG per PSI below spec (NHTSA data), meaning a truck 20 PSI low is burning 4% more fuel every mile. Add a dirty air filter, a leaking injector nozzle, and misaligned axles, and the same truck can be running 15-20% below its own baseline MPG without a single warning light. The good news: every one of these fuel economy killers is catchable in routine PM if the fleet knows what to look for. This article ranks the top 15 maintenance issues that kill diesel truck fuel economy in 2026, with the MPG impact data, the root cause, and the PM interval that catches each one before it costs a full tank. Sign up free for Truck Inspection & Maintenance today — no credit card required to track MPG-affecting PM triggers across your fleet, or contact our team for a fuel economy audit configured to your truck mix and duty cycle.
Top 15 Maintenance Issues That Kill Diesel Truck Fuel Economy
Every issue ranked by MPG impact, with the root cause and the PM interval that catches it before it costs a full tank.
The Top 15 MPG Killers — Ranked by Impact
Each issue below shows the typical MPG loss range, the root cause explanation, and the PM interval that catches it. Fleets that address the top 5 alone typically recover 8-12% MPG within 90 days.
Under-Inflated Tires
3-6% MPG lossFailing Fuel Injectors
3-5% MPG lossMisaligned Axles
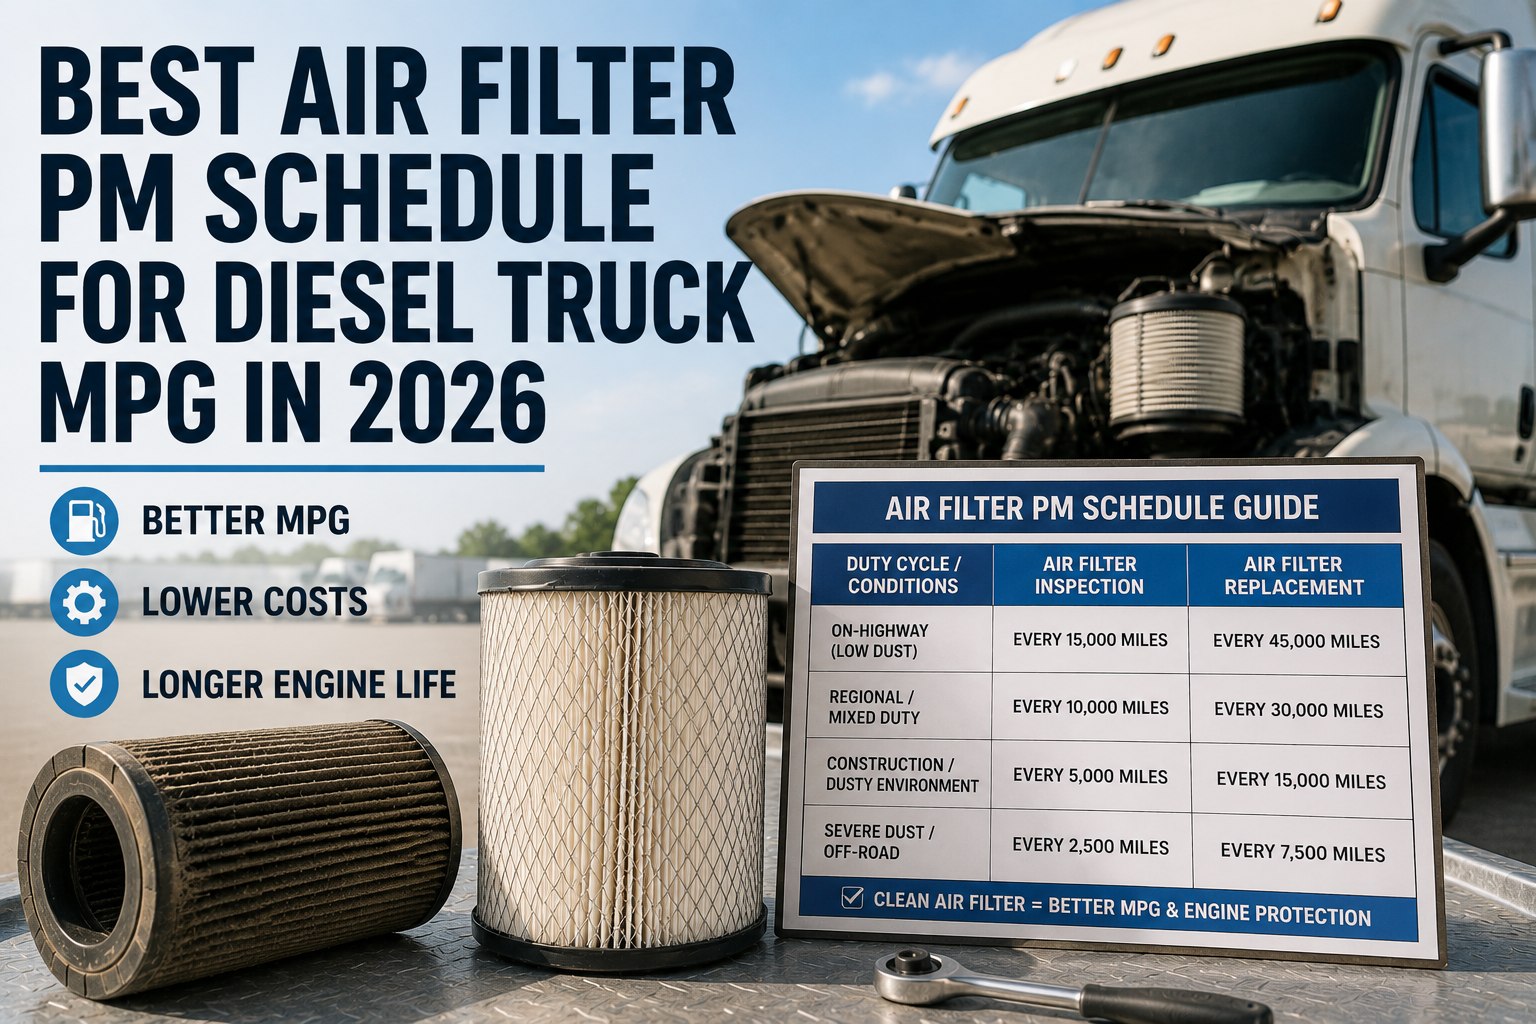
2-4% MPG lossClogged Air Filter
2-4% MPG lossDPF Excessive Regeneration
2-4% MPG lossAerodynamic Damage
2-3% MPG lossDragging Brakes
2-3% MPG lossWrong Engine Oil Viscosity
1-2% MPG lossFaulty Oxygen / NOx Sensors
1-3% MPG lossCoolant Temperature Issues
1-2% MPG lossWheel Bearing Drag
1-2% MPG lossTurbocharger Wear
1-3% MPG lossEGR System Faults
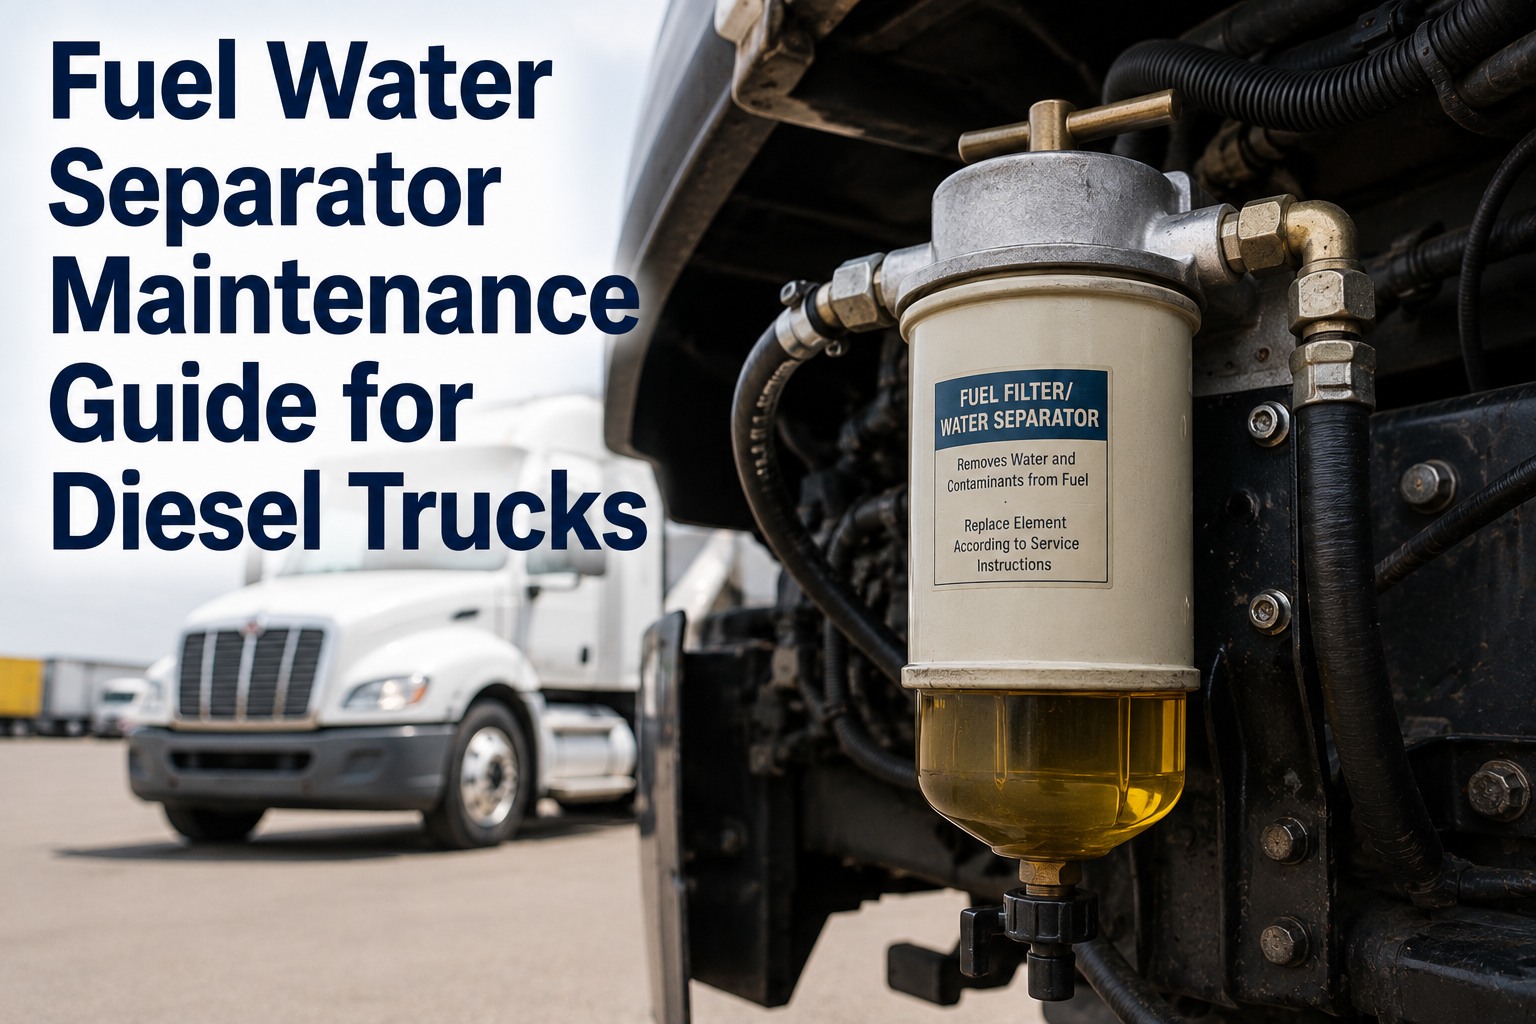
1-3% MPG lossFuel Filter Restriction
1-2% MPG lossTire Tread Wear (Uneven or Excessive)
1-2% MPG lossThe 4 MPG Killer Tiers — How to Prioritize
Not every issue deserves equal attention. Sort by MPG impact and PM cost to tackle the biggest wins first.
Catch every MPG killer at the PM interval that matters
TPMS integration for real-time tire pressure. J1939 boost/coolant/fuel-rate monitoring for engine issues. Alignment scheduling. DPF regen tracking. Auto work orders on MPG drift >3%. Systematic fuel economy audit built into every PM.
MPG Impact Reference Table
Quick-reference for prioritizing PM investment. Numbers reflect typical fleet averages — individual truck impact varies with duty cycle and baseline condition.
| MPG Killer | MPG Loss | Detection Method | Fix Cost Range |
|---|---|---|---|
| Under-inflated tires | 3-6% | TPMS, pre-trip gauge | $5-$15 |
| Failing fuel injectors | 3-5% | Cylinder balance, ELD | $800-$3,500 |
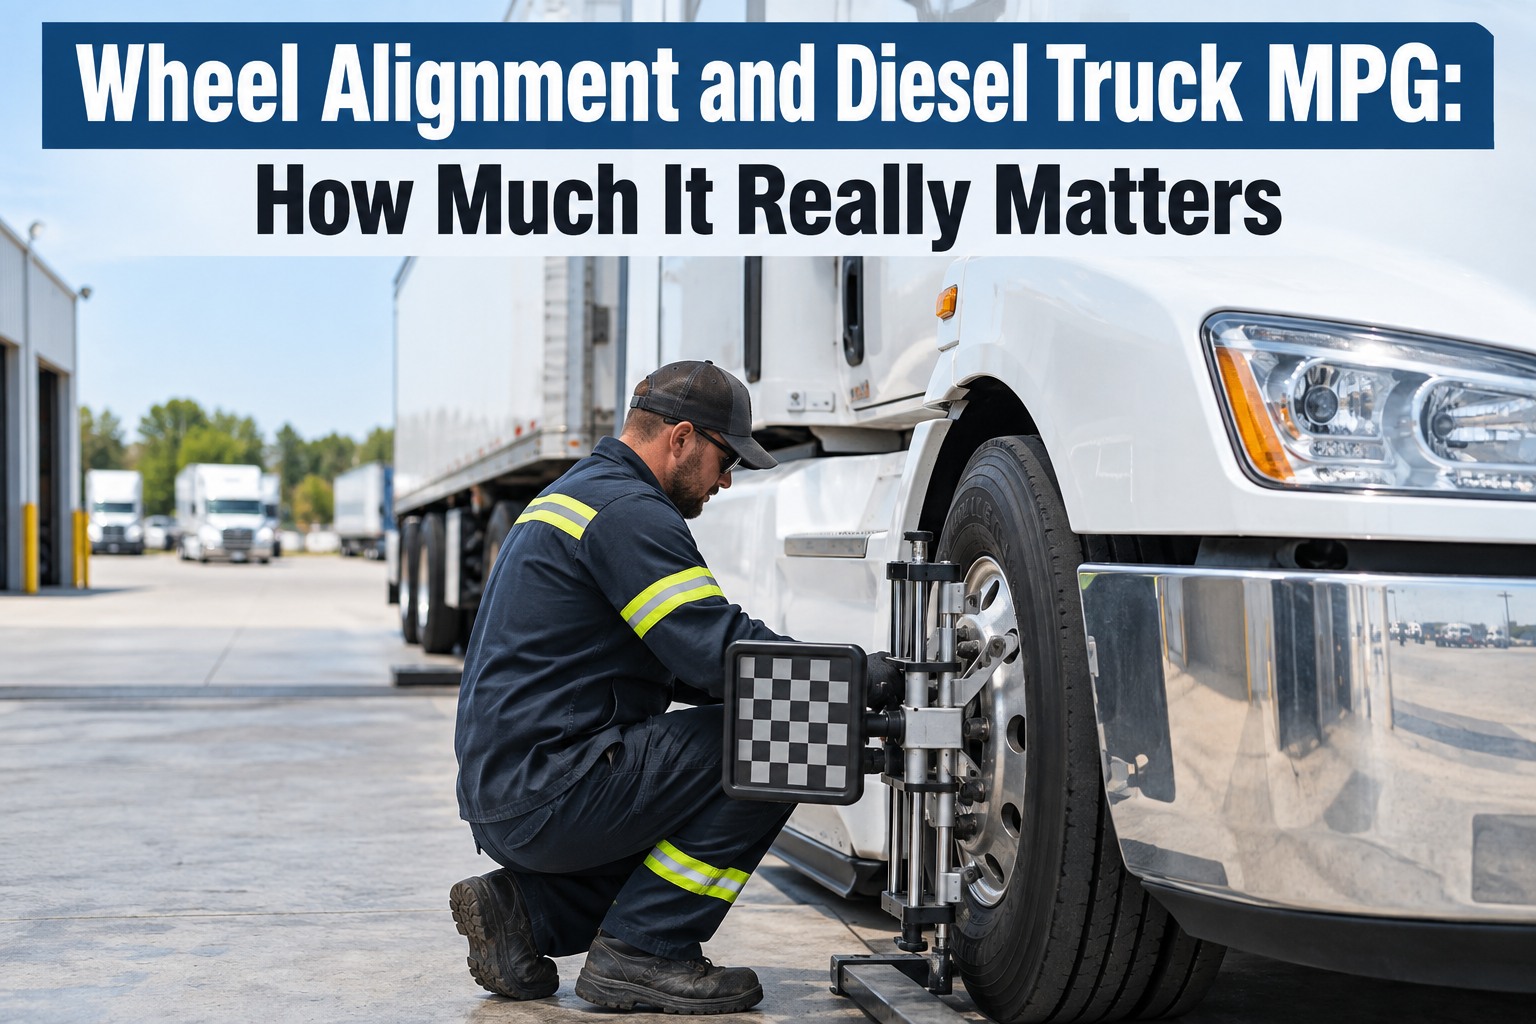
| Misaligned axles | 2-4% | Alignment check, tire wear | $200-$500 |
| Clogged air filter | 2-4% | Intake restriction sensor | $40-$120 |
| DPF over-regen | 2-4% | Regen frequency tracking | $400-$1,500 |
| Aerodynamic damage | 2-3% | Visual DVIR inspection | $150-$800 |
| Dragging brakes | 2-3% | Hub temp check | $300-$1,200 |
| Wrong oil viscosity | 1-2% | Oil spec verification | $0 (next change) |
| Faulty O2/NOx sensors | 1-3% | Sensor drift analysis | $200-$600 |
| Coolant temp issues | 1-2% | J1939 temp monitoring | $150-$500 |
| Wheel bearing drag | 1-2% | Hub temp check | $200-$700 |
| Turbocharger wear | 1-3% | Boost pressure monitoring | $1,500-$4,500 |
| EGR system faults | 1-3% | DTC + MPG correlation | $300-$1,200 |
| Fuel filter restriction | 1-2% | Fuel pressure monitoring | $25-$80 |
| Tire tread wear | 1-2% | Tread depth check DVIR | $400-$700 per tire |
The Fuel Economy PM Program — 90-Day Plan
Fleets don't fix all 15 issues at once. This is the sequenced 90-day rollout that typically recovers 8-12% MPG on first pass.
Frequently Asked Questions
Typical mid-size fleets recover 8-12% MPG within the first 90 days of a systematic fuel economy PM program, with total available recovery of 15-20% over 12 months for fleets starting from a maintenance-neglected baseline. The single biggest win is under-inflated tires (3-6% MPG loss) which is also the cheapest to fix. Tier 1 issues (tires, injectors, alignment, air filter) account for 8-12% recovery. Tier 2 (DPF, aerodynamics, brakes, oil, sensors) adds another 4-6%. Tier 3 issues (coolant, bearings, turbo, EGR, fuel filter, tread) preserve gains and add 2-4% continuous. The 30% MPG variance across similar trucks running similar routes is almost entirely maintenance and behavior — meaning most fleets have real recoverable fuel savings sitting in their yard right now.
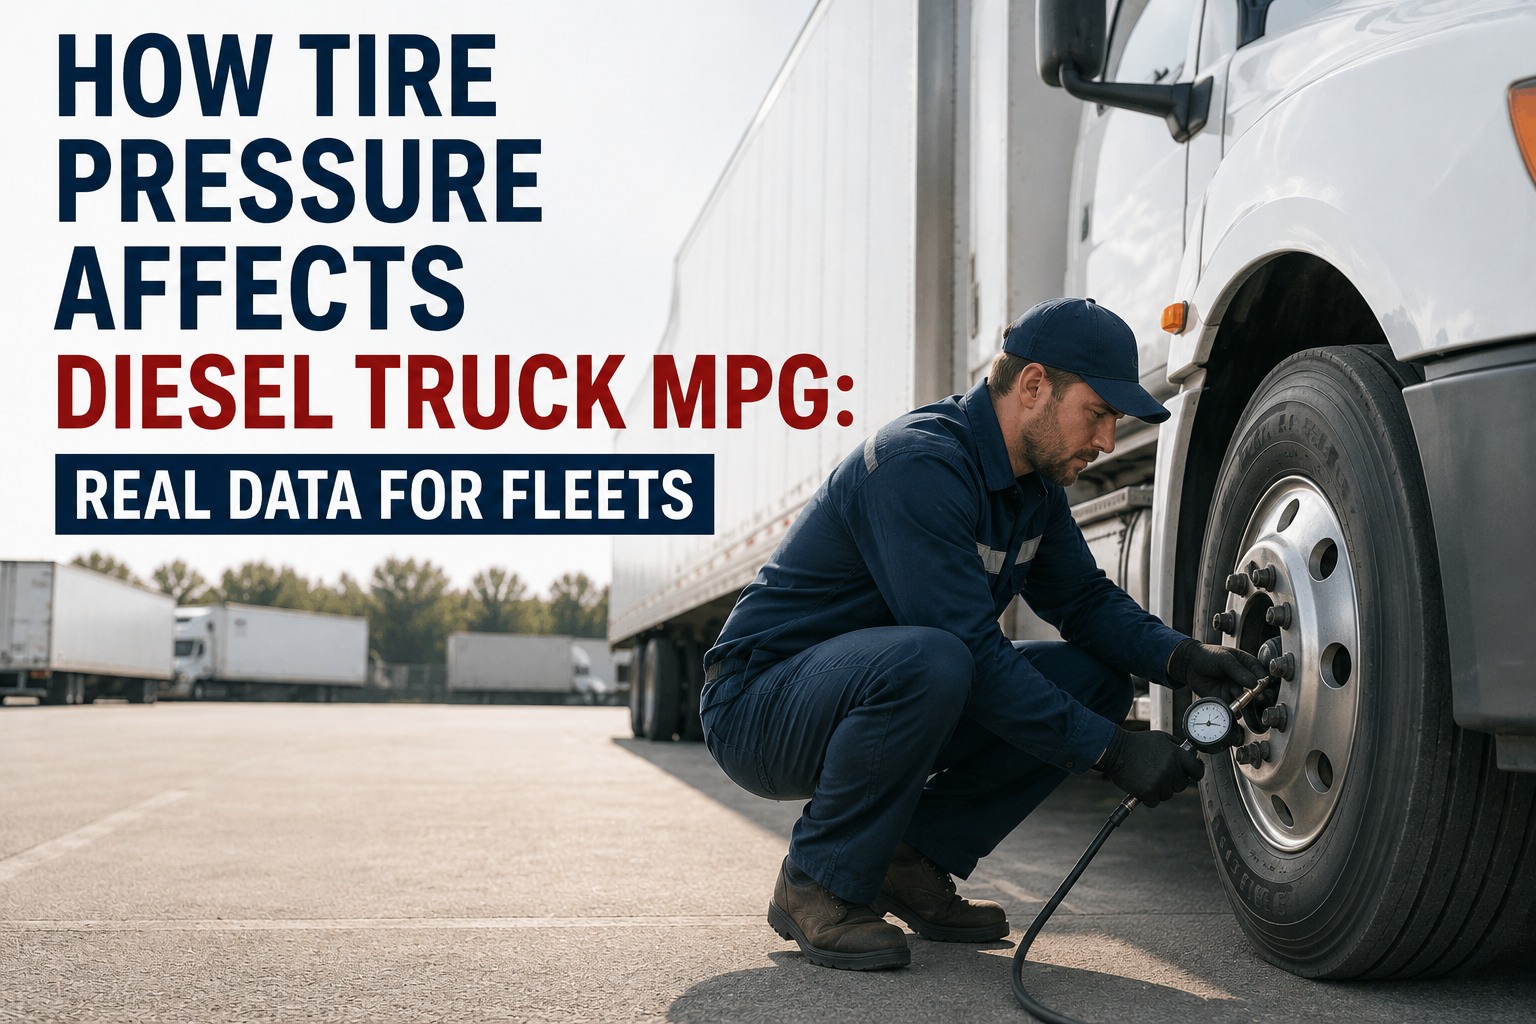
Rolling resistance is one of the top three forces the engine works against — along with aerodynamic drag and gravity. Under-inflated tires deform more against the road surface, creating a larger contact patch and more friction. NHTSA data quantifies this: 0.2% MPG loss for every 1 PSI below OEM spec. A truck 20 PSI under is burning 4% more fuel every mile. On a fleet running 100,000 miles per truck per year at $4/gallon and 6.5 baseline MPG, that 4% is roughly $2,460 per truck per year in extra fuel from under-inflation alone. TPMS (tire pressure monitoring systems) eliminate this by alerting the driver or fleet the moment pressure drops. Fleets without TPMS should require pre-trip PSI checks with a gauge on every dispatch — visual "it looks OK" doesn't catch 20 PSI under.
Yes — J1939 data streams several signals that reveal MPG-affecting issues weeks before power loss is felt. Cylinder balance metrics show injector wear before ignition roughness appears. Intake restriction sensor readings indicate air filter clogging before turbo boost drops. Boost pressure deviation from baseline reveals turbo wear before EGT climbs. Regen frequency tracking catches DPF issues before the warning light. Coolant temp streaming catches thermostat problems before overheat. Fuel rate per mile trending flags any MPG drift >3% for investigation, isolating the truck before the driver reports "she's running worse." A modern fleet maintenance platform correlates all these signals with MPG data and auto-opens work orders when patterns emerge. This is condition-based fuel economy management vs. calendar-based, and produces dramatically better MPG outcomes. Try the platform free to see ELD-driven fuel economy monitoring in action.
Both matter, roughly 50/50 on typical fleets. Driver behavior (hard braking, over-revving, high idle, speeding, aggressive acceleration) can account for 15-30% MPG variance between smooth and aggressive drivers on identical trucks. Maintenance condition (the 15 issues in this article) accounts for another 15-20% variance between well-maintained and neglected trucks. The two compound: an aggressive driver on a poorly-maintained truck can run 30%+ worse MPG than a smooth driver on a well-maintained one. The good news is both are addressable. Driver behavior improves through coaching programs built on ELD data — typically 30-60 days to measurable improvement. Maintenance improves through the 90-day PM program outlined above. Fleets that attack both simultaneously see the biggest MPG gains, often 15-20% cumulative within the first year.
Faster than almost any other fleet investment. Rough math: a 50-truck fleet running 100,000 miles per truck at 6.5 MPG and $4/gallon burns $3.08M in diesel per year. A 10% MPG gain = $308,000 annual fuel savings. Investment: TPMS deployment ($150-$300 per truck × 50 = $7,500-$15,000), alignment corrections ($200-$500 × maybe 30 trucks = $6,000-$15,000), air filters ($40-$120 × 50 = $2,000-$6,000), and staff time for the 90-day rollout. Total investment typically under $50,000 for the first pass, producing $300K+ ongoing annual savings. That's a 6x return in year one, then pure savings continuing every year after. Even the highest-cost Tier 1 fix (injector replacement at $3,500) pays back in weeks on a truck running 100K miles annually. Fuel economy PM is one of the most reliably profitable maintenance investments available.
Almost never — and the ones that do work are the same aerodynamic components OEMs already offer (side skirts, trailer tails, cab extenders, gap reducers). Fuel additives with "MPG boost" claims rarely produce measurable results and often void warranty. "Fuel-saving" magnets, vortex generators, and airflow devices consistently fail independent testing. The real MPG gains come from the boring fundamentals: correct tire pressure, clean air filter, sharp injectors, aligned axles, functioning aftertreatment, aerodynamic components in good repair, and appropriate driver behavior. If a truck is 15% below its baseline MPG, the answer is almost certainly one of the 15 issues in this article — not an additive or a device. Save the aftermarket budget for actual maintenance and OEM aerodynamic upgrades that have documented performance data. Contact our team for a data-based fuel economy audit rather than aftermarket experimentation.
Continuously if possible, weekly at minimum, per truck (not per fleet average). Fleet averages hide the outliers. A fleet averaging 6.5 MPG might have 20% of trucks running at 5.5 MPG and dragging the average down while the healthy trucks are hitting 7.2 MPG. Per-truck tracking isolates which trucks need attention. Modern platforms auto-calculate MPG from fuel purchase data and telematics odometer readings, flagging any truck that drifts >3% below its own baseline. This drift-based approach is more useful than absolute MPG because it accounts for load, route, and season — a truck running its normal route with its normal load should hit similar MPG week to week, and deviation is the diagnostic signal. Fleets that track per-truck MPG weekly catch developing issues weeks before symptoms appear on the dash, and can address them in scheduled PM rather than as unplanned repairs. This is the single most impactful data practice for fuel economy management.
Turn every PM into a fuel economy audit — automatically
TPMS integration for real-time tire pressure. J1939 boost/coolant/fuel-rate monitoring for engine issues. Alignment scheduling. DPF regen tracking. Cylinder balance analysis. Auto work orders on MPG drift >3% per truck. Move from calendar PM to fuel-economy-optimized PM — recover 8-12% MPG in the first 90 days.