Last-mile delivery is the most expensive, most visible, and most measurable segment of the e-commerce supply chain — yet most logistics teams track it on lagging weekly reports that surface problems long after they've cost money. The data is unforgiving: McKinsey research shows last-mile delivery represents up to 53% of total shipping costs, and Gartner attributes up to 40% of avoidable customer service contacts to poor delivery performance. Industry leaders hit 95%+ on-time delivery and 90%+ first-attempt success while average operations drift below 85%. The gap is not effort — it's measurement discipline. The 12 KPIs in this guide are the metrics top last-mile operators actually track daily, organized by the four strategic categories that balance service, cost, efficiency, and customer experience. Track them with the right targets and benchmarks and the operational picture shifts from reactive to predictive. Truck Inspection & Maintenance surfaces every one of these KPIs from live delivery data — no Friday spreadsheet rebuilds. Start your free trial and run your last-mile dashboard on real-time data.
Top 12 Last-Mile Delivery KPIs
The metrics top logistics teams track daily to control cost, protect SLAs, and scale delivery operations in 2026.
Why Last-Mile KPIs Are Make-or-Break in 2026
Last-mile economics are brutal. Logistics costs run 10-15% of total sales for retail and consumer goods companies — and within that, last-mile is the dominant share. A single percentage point of on-time delivery lost shows up as SLA penalties, customer churn, refunds, and reattempt cost. The 12 KPIs below are the operational levers that move the needle when measured in real time:
Service KPIs
OTD rate, first-attempt success, average delivery time, time-window accuracy. The customer-facing metrics.
Cost KPIs
Cost per stop, cost per delivery, delivery cost as % revenue. The unit economics that determine margin.
Efficiency KPIs
Stops per hour, route efficiency, vehicle utilization. The operational levers behind cost and service.
Customer KPIs
Order accuracy, CSAT/NPS. The trailing indicators that predict repeat orders and churn.
The 12 Last-Mile KPIs — Formula, Target & Why It Matters
Each KPI below includes the calculation formula, the 2026 industry benchmark, and the specific operational lever it triggers when it drifts off target. Truck Inspection & Maintenance tracks every one of them in real time from live dispatch data:
On-Time Delivery Rate (OTD)
The gold standard reliability metric. Every SLA, customer expectation, and contract clause rides on this number.
First-Attempt Delivery Success
The single highest-leverage cost metric. Failed first attempt adds 40-60% to that delivery's true cost.
Average Delivery Time
From dispatch to recipient handoff. Tracks operational efficiency and customer experience together.
Time Window Accuracy
The customer-experience refinement of OTD. Hitting the promised window — not just the calendar day — drives CSAT.
Cost Per Stop
The density metric. Drops sharply as stops/route increase — doubling 20→40 stops can cut cost/stop by more than half.
Cost Per Delivery (All-In)
True per-delivery cost including failed attempts, returns, and admin overhead. CIGO reports 20-30% reduction with optimization.
Delivery Cost as % Revenue
Profitability check. Successful operations land in 5-15% range; higher signals route, density, or failed-delivery problems.
Stops Per Hour
Driver productivity benchmark. Routing quality, dwell time, and dispatch density all flow into this single number.
Route Efficiency
Adherence to optimized route. Drops below 80% signal traffic, driver deviation, or stale routing logic.
Vehicle Capacity Utilization
How much of each van/truck is earning revenue. Top performers consolidate to 85%+; under-loaded = wasted route cost.
Order Accuracy Rate
Right item, right quantity, no damage. Errors trigger returns, refunds, support contacts — silent margin killers.
CSAT / NPS Score
The leading indicator of repeat orders and churn. Tie satisfaction to drivers, routes, and neighborhoods to coach precisely.
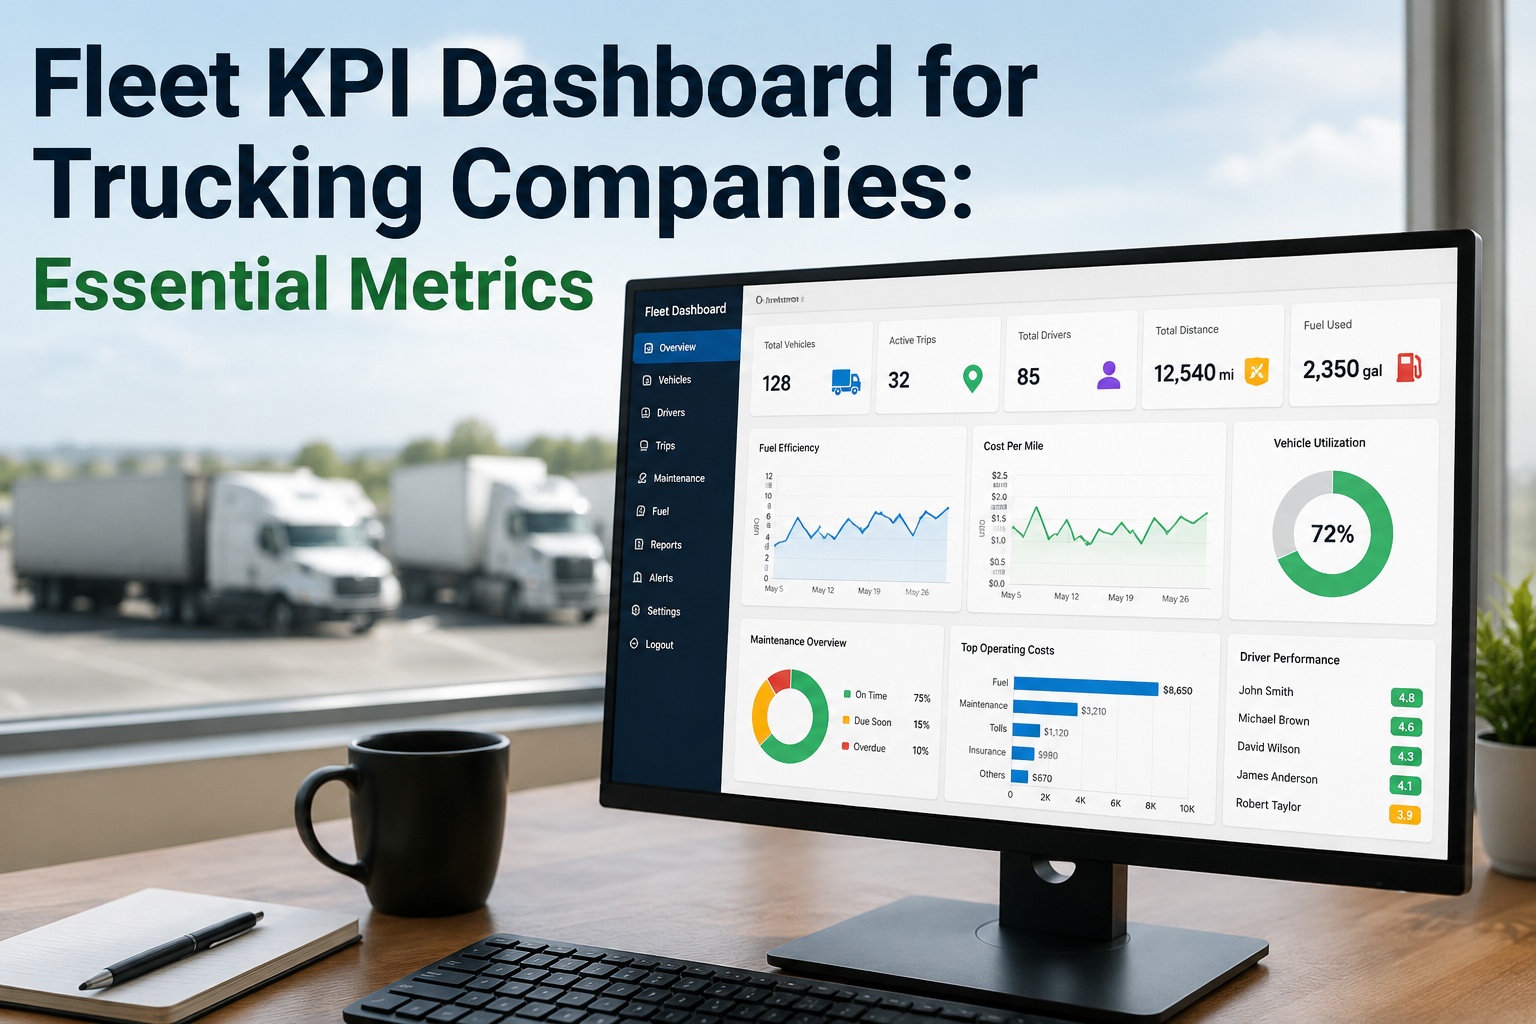
Track all 12 KPIs from live delivery data.
Truck Inspection & Maintenance surfaces every last-mile KPI in real time — service, cost, efficiency, and customer metrics on one dashboard with drill-down per route, driver, and stop. Free for up to 3 vehicles. Contact support to plan your rollout.
2026 Benchmarks — Where Top Operators Land
Knowing the number doesn't help without context. Here's how top-quartile, industry-average, and struggling last-mile operators land on the metrics that matter most. The gap from average to top quartile is where the ROI lives:
The Compounding Impact — Why One KPI Lifts the Others
Last-mile KPIs are not independent — they reinforce each other. Move first-attempt success up 5 points and cost per stop drops, CSAT rises, route efficiency improves. The visualization below shows the cascade:
First-Attempt Success
Move from 85% → 90% first-attempt rate through better address quality, pre-delivery notifications, and time windows.
Reattempt Cost
Each failed attempt adds 40-60% to that delivery's cost. Cutting failures cuts reattempts and the cost stack behind them.
Stops Per Hour
Drivers spend less time on retry routes and customer-service hand-offs. More productive stops per shift.
CSAT Score
Customers who get their package on the first try rate the experience higher. Repeat-order rate moves with it.
Support Ticket Volume
Gartner attributes up to 40% of avoidable customer service contacts to poor delivery. Cut delivery issues, cut tickets.
Annual Impact
50-truck fleet running 80,000 stops/year. The compounding gains across reattempt, productivity, support, and churn.
How to Act on KPIs — Daily, Weekly, Monthly Cadence
Tracking KPIs is necessary but not sufficient. The real lift comes from acting on them at the right cadence. Top last-mile teams follow this rhythm:
Daily — 10-Minute Check
Review live OTD, first-attempt rate, exception alerts. Catch issues during execution window — not after the day closes. Re-route or intervene where service is at risk.
Weekly — Driver & Route Deep-Dive
Driver scorecards by stops/hour, on-time rate, CSAT. Route performance trends. Coaching conversations with drivers below cohort average.
Monthly — Cost & Capacity
Cost per stop trend, vehicle utilization, delivery cost % revenue. Fleet right-sizing review. Budget vs actual reconciliation.
Quarterly — Strategic Adjust
Benchmark vs industry peers. Target reset on each KPI. Investment decisions on routing tech, fleet mix, lockers/PUDO partners.
Frequently Asked Questions
How many last-mile KPIs should we actually track?
4 "north star" KPIs prominently (OTD, first-attempt success, cost per stop, CSAT) backed by 6-8 supporting metrics. Dashboards showing 20+ KPIs with equal visual weight cause "dashboard fatigue" and stop getting used. The 12 KPIs in this guide are the working set — but only 4 belong on the top of the dashboard.
Which last-mile KPI matters most for profitability?
First-attempt delivery success rate, by a wide margin. Each failed first attempt adds 40-60% to that delivery's true cost (fuel, labor, customer service, return handling). Moving from 85% to 92% first-attempt across a 50-truck fleet running 80,000 stops/year recovers $200K+ annually in eliminated reattempt cost alone.
What's the industry benchmark for on-time delivery in last-mile?
95%+ for top-quartile operators in 2026, 88-92% industry average, below 85% for struggling operations. McKinsey research and PwC studies consistently show that operators using real-time visibility tools improve OTD by 12-22 percentage points within 12 months — the lift comes from acting on live data instead of post-mortem reports.
How does Truck Inspection & Maintenance support last-mile KPIs?
The platform surfaces all 12 KPIs from live delivery data — OTD, first-attempt, cost per stop, stops/hour, route efficiency, utilization, accuracy, CSAT. Tiered dashboard architecture: 4 North Stars at the top, 6 diagnostic metrics in a secondary band, drill-down per route/driver/stop. Real-time alerts when any KPI drifts outside target range. Sign up free to see your first 3 trucks live.
How often should we review last-mile KPI dashboards?
Tiered cadence works best. Daily 10-minute checks for live alerts and exceptions. Weekly deep-dives for driver and route performance. Monthly leadership reviews for cost trends and capacity. Quarterly strategic resets vs industry benchmarks. The platform automates the data — managers just review and act on it.
Should we track carbon footprint as a last-mile KPI in 2026?
Yes — ESG reporting is becoming standard for any e-commerce or 3PL operation working with major retailers (Amazon, Walmart, Target all require it). Carbon-per-delivery, route CO2 emissions, and electric/alternative-fuel mile percentage are now common dashboard additions alongside the 12 KPIs in this guide. Talk to our team for ESG metric configuration.
Track the 12 KPIs that actually move last-mile margin.
Truck Inspection & Maintenance delivers real-time service, cost, efficiency, and customer metrics with drill-down per route and driver — built for e-commerce and 3PL last-mile operations. Free for up to 3 vehicles. No hardware. No contracts.